Bitget App
Trade smarter

Bitget: Ranked top 4 in global daily trading volume!
BTC dominance57.84%
Current ETH GAS: 0.5-2 gwei
Hot BTC ETF: IBIT
Bitcoin halving: 4th in 2024, 5th in 2028
BTC/USDT$111576.59 (-2.03%)Fear and Greed Index47(Neutral)
Altcoin season index:0(Bitcoin season)
Coins listed in Pre-MarketWLFITotal spot Bitcoin ETF netflow -$23.2M (1D); -$961.8M (7D).Welcome gift package for new users worth 6200 USDT.Claim now
Trade anytime, anywhere with the Bitget app.Download now


The Graph (GRT) price Prediction
Listed
How much could The Graph be worth in 2025, 2026, 2030, and beyond? What's the predicted price of The Graph for tomorrow, this week, or this month? And what return on investment might you get by holding The Graph until 2050?
This page offers both short- and long-term The Graph price prediction tools to help you evaluate The Graph's future price performance. You can also set your own forecasts to estimate the future value of The Graph.
It is important to note that, given the inherent volatility and complexity of the cryptocurrency market, these predictions—while offering insights into potential price ranges and scenarios—should be viewed with caution and skepticism.
The Graph price prediction chart for 2025 and beyond
Predicting The Graph's price in the next 10 days based on a predicted daily growth rate of +0.014%.
Price today (Aug 25, 2025)
$0.09279
Price tomorrow (Aug 26, 2025)
$0.09280
Price in 5 days (Aug 30, 2025)
$0.09286
Price this month (Aug 2025)
$0.09294
Price next month (Sep 2025)
$0.09333
Price in 5 months (Jan 2026)
$0.09490
Price in 2025
$0.09507
Price in 2026
$0.09982
Price in 2030
$0.1213
Based on the short-term The Graph daily price predictions, the price of The Graph is projected to be $0.09279 on Aug 25, 2025, $0.09280 on Aug 26, 2025, and $0.09286 on Aug 30, 2025. For The Graph monthly price predictions, the price of The Graph is projected to be $0.09294 in Aug 2025, $0.09333 in Sep 2025, and $0.09490 in Jan 2026. For long-term The Graph yearly price predictions, the price of The Graph is projected to be $0.09507 in 2025, $0.09982 in 2026, and $0.1213 in 2030.
The Graph price prediction for today
The current price of The Graph (GRT) is $0.08915, with a 24h price change of 0.00%. The price of The Graph (GRT) is expected to reach $0.09279 today. Learn more about The Graph price today.
The Graph price prediction for Aug 2025
The price of The Graph (GRT) is expected to change by -1.35% in Aug 2025, and the price of The Graph (GRT) is expected to reach $0.09294 by the end of Aug 2025.
The Graph price prediction for 2025
The price of The Graph (GRT) is expected to change by -52.31% in 2025, and the price of The Graph (GRT) will reach $0.09507 by the end of 2025.
Long-term The Graph price prediction: 2026, 2030, 2035, 2040, 2050
The following is a The Graph price prediction model based on a fixed growth rate. It ignores the impact of market fluctuations, external economic factors, or emergencies, and instead focuses on the average price trend of The Graph. It helps investors analyzes and quickly calculate the profit potential of investing in The Graph.
Enter your predicted annual growth rate for The Graph price, and see how the The Graph value will change in the future.
Enter your predicted annual growth rate for The Graph price, and see how the The Graph value will change in the future.
Yearly The Graph price prediction based on 5% predicted annual growth
%
Predicted annual growth. Enter a percentage between -100% and +1000%.
| Year | Predicted price | Total ROI |
|---|---|---|
2026 | $0.09982 | +5.00% |
2027 | $0.1048 | +10.25% |
2028 | $0.1101 | +15.76% |
2029 | $0.1156 | +21.55% |
2030 | $0.1213 | +27.63% |
2035 | $0.1549 | +62.89% |
2040 | $0.1976 | +107.89% |
2050 | $0.3219 | +238.64% |
Based on an annual growth rate of 5%, the The Graph (GRT) price is expected to reach $0.09982 in 2026, $0.1213 in 2030, $0.1976 in 2040, and $0.3219 in 2050.
The Graph price prediction for 2026
In 2026, based on a predicted annual growth rate of 5%, the price of The Graph (GRT) is expected to reach $0.09982. Based on this forecast, the cumulative return on investment from holding The Graph until the end of 2026 would be 5.00%.
The Graph price prediction for 2030
In 2030, based on a predicted annual growth rate of 5%, the price of The Graph (GRT) is expected to reach $0.1213. Based on this forecast, the cumulative return on investment from holding The Graph until the end of 2030 would be 27.63%.
The Graph price prediction for 2035
In 2035, based on a predicted annual growth rate of 5%, the price of The Graph (GRT) is expected to reach $0.1549. Based on this forecast, the cumulative return on investment from holding The Graph until the end of 2035 would be 62.89%.
The Graph price prediction for 2040
In 2040, based on a predicted annual growth rate of 5%, the price of The Graph (GRT) is expected to reach $0.1976. Based on this forecast, the cumulative return on investment from holding The Graph until the end of 2040 would be 107.89%.
The Graph price prediction for 2050
In 2050, based on a predicted annual growth rate of 5%, the price of The Graph (GRT) is expected to reach $0.3219. Based on this forecast, the cumulative return on investment from holding The Graph until the end of 2050 would be 238.64%.
How much will you earn from your The Graph?
If you invest $100 in The Graph this year and hold until 2026, the price prediction suggests a potential profit of $5, reflecting a 5.00% ROI. (Fees are not included in this estimate).
Disclaimer: This is not investment advice. The information provided is for general informational purposes only. No information, materials, services and other content provided on this page constitute a solicitation, recommendation, endorsement, or any kind of financial, investment, or other advice. Seek independent professional consultation in the form of legal, financial, and fiscal advice before making any investment decision.
Short-term The Graph price prediction table
Daily The Graph price prediction based on a 0.014% predicted daily growth
What is the The Graph price prediction for tomorrow, 5 days, 10 days, and beyond?%
Predicted daily growth. Enter a percentage between –100% and +1000%.
| Date | Predicted price | Total ROI |
|---|---|---|
Aug 26, 2025 (Tomorrow) | $0.09280 | +0.01% |
Aug 27, 2025 | $0.09282 | +0.03% |
Aug 28, 2025 | $0.09283 | +0.04% |
Aug 29, 2025 | $0.09284 | +0.06% |
Aug 30, 2025 (5 days later) | $0.09286 | +0.07% |
Aug 31, 2025 | $0.09287 | +0.08% |
Sep 1, 2025 | $0.09288 | +0.10% |
Sep 2, 2025 | $0.09289 | +0.11% |
Sep 3, 2025 | $0.09291 | +0.13% |
Sep 4, 2025 (10 days later) | $0.09292 | +0.14% |
Based on a daily growth rate of 0.014%, the price of The Graph (GRT) is expected to reach $0.09280 in Aug 26, 2025, $0.09286 in Aug 30, 2025, and $0.09292 in Sep 4, 2025.
The Graph price prediction for Aug 26, 2025
Based on the daily growth rate of 0.014% for The Graph price prediction, the estimated value of 1 The Graph will be $0.09280 on Aug 26, 2025 (Tomorrow). The expected ROI from investing and holding The Graph until the end of Aug 26, 2025 is 0.01%.
The Graph price prediction for Aug 30, 2025
Based on the daily growth rate of 0.014% for The Graph price prediction, the estimated value of 1 The Graph will be $0.09286 on Aug 30, 2025 (5 days later). The expected ROI from investing and holding The Graph until the end of Aug 30, 2025 is 0.07%.
The Graph price prediction for Sep 4, 2025
Based on the daily growth rate of 0.014% for The Graph price prediction, the estimated value of 1 The Graph will be $0.09292 on Sep 4, 2025 (10 days later). The expected ROI from investing and holding The Graph until the end of Sep 4, 2025 is 0.14%.
Monthly The Graph price prediction based on a 0.42% predicted monthly growth
What is the The Graph price prediction for next month, 5 months, 10 months, and beyond?%
Predicted monthly growth. Enter a percentage between –100% and +1000%.
| Date | Predicted price | Total ROI |
|---|---|---|
Sep 2025 (Next month) | $0.09333 | +0.42% |
Oct 2025 | $0.09372 | +0.84% |
Nov 2025 | $0.09411 | +1.27% |
Dec 2025 | $0.09451 | +1.69% |
Jan 2026 (5 months later) | $0.09490 | +2.12% |
Feb 2026 | $0.09530 | +2.55% |
Mar 2026 | $0.09570 | +2.98% |
Apr 2026 | $0.09610 | +3.41% |
May 2026 | $0.09651 | +3.84% |
Jun 2026 (10 months later) | $0.09691 | +4.28% |
Based on a monthly growth rate of 0.42%, the price of The Graph (GRT) is expected to reach $0.09333 in Sep 2025, $0.09490 in Jan 2026, and $0.09691 in Jun 2026.
The Graph price prediction for Sep 2025
Based on a monthly growth rate of 0.42%, the predicted price of The Graph (GRT) in Sep 2025 (Next month) is $0.09333. The expected ROI from investing and holding The Graph until the end of Sep 2025 is 0.42%.
The Graph price prediction for Jan 2026
Based on a monthly growth rate of 0.42%, the predicted price of The Graph (GRT) in Jan 2026 (5 months later) is $0.09490. The expected ROI from investing and holding The Graph until the end of Jan 2026 is 2.12%.
The Graph price prediction for Jun 2026
Based on a monthly growth rate of 0.42%, the predicted price of The Graph (GRT) in Jun 2026 (10 months later) is $0.09691. The expected ROI from investing and holding The Graph until the end of Jun 2026 is 4.28%.
Trending cryptocurrency price prediction articles
Token6900: Presale Guide, Staking Rewards (Brain Rot Vault) & Price
Token6900 (T6900) is an ERC-20 meme token that treats attention as its core currency. Built around the cultural appeal of “6900” and the dynamics of online communities, the project centers on a public-only sale with a hard cap, optional staking during the sale, and a simple claim process at TGE. The Token6900 presale is designed to be open, time-bound, and transparent, with stage-based pricing that rewards early participation. This guide explains what Token6900 is, breaks down its tokenomics with an emphasis on the sale mechanics, shows how to participate in the Token6900 presale, and outlines scenario-based price considerations in a neutral, non-promotional way.
What is Token6900?
Token6900 calls itself the “apex predator of meme markets,” explicitly forgoing traditional utility to lean fully into culture and attention. Drawing direct inspiration from SPX6900, it sets its total supply at one token higher as a playful “one-up.” The project’s vision is to elevate “6900” into a tradable meme unit of value through the T6900 ticker, with community participation and the Token6900 presale at the heart of the launch. In practice, Token6900 emphasizes a capped public sale, equal terms for buyers, and a staking mechanism, while acknowledging that price action will be driven by attention, liquidity, and listings rather than fundamentals. This positioning makes Token6900 an experiment in crowd-driven markets where momentum—and the ability to sustain it—matters most.
Token6900 Tokenomics
Token6900 is an ERC-20 asset with a fixed supply of 930,993,091 T6900—deliberately one token more than SPX6900. The Token6900 presale is the centerpiece: it is hard-capped at $5 million, and up to 80% of supply may be sold publicly, with the final amount dependent on demand. Pricing advances in stages from $0.006400 to $0.007125, with each stage running for two days or until its tranche sells out. The team states there are no private rounds, venture allocations, or backdoor deals, putting all presale participants on equal footing.
Beyond the sale, Token6900 outlines a distribution model that includes 10% for liquidity (locked in a DEX pool for 12 months), 40% for marketing, 15% for development, 5% for staking rewards, and 5% for rewards, airdrops, or burns. Approximately 24.9993% is deliberately left unspecified to be finalized at or after TGE, and a symbolic 0.0007% developer allocation (6,900 tokens) is locked for five years. Because the team also notes that up to 80% of supply may be sold in the Token6900 presale, final allocations may be adjusted depending on the sale outcome.
Staking is the project’s primary functional feature, implemented through the on-chain “Brain Rot Vault.” A pool of 46,549,655 T6900 (5% of supply) is preloaded to fund staking rewards. Staking opens when the Token6900 presale begins and remains available until 365 days after TGE. Emissions are fixed per block, so nominal yields decline as more participants stake. Tokens staked on purchase—and any accrued rewards—are subject to a linear 30-day vesting period after TGE.
How to Join the Token6900 Presale
The Token6900 presale is designed to be public and accessible, with a projected window in Q3–Q4 2025 (subject to change). To participate, prepare an ERC-20 compatible wallet such as MetaMask, Trust Wallet, or Best Wallet, and fund it with a supported asset. According to the team, ETH (ERC-20), USDT (ERC-20), BNB (BEP-20), USDT (BEP-20), and major credit cards via a payment gateway will be accepted.
Steps to join the Token6900 presale:
Visit the official presale portal and verify the URL through the project’s official channels.
Connect your wallet and select your preferred payment asset.
Review the current stage’s price and confirm your purchase.
After the sale concludes, claim tokens at TGE via the official claim page to any standard ERC-20 wallet.
Participants can also opt to stake their purchased tokens during the Token6900 presale to begin accruing rewards in the Brain Rot Vault. Keep in mind that both staked tokens and rewards follow a linear 30-day vesting schedule after TGE. As always, double-check contract addresses and links to avoid phishing and impersonation risks when joining the Token6900 presale.
Token6900 Price Prediction
Like most meme-driven assets, Token6900’s price is likely to respond more to attention, liquidity depth, and listing cadence than to conventional fundamentals. At the starting presale price of $0.006400, the implied fully diluted valuation (FDV) is roughly $5.96 million; at the final stage price of $0.007125, the FDV is about $6.63 million, based on the fixed supply of 930,993,091 tokens.
Conservative scenario: If attention fades post-TGE or liquidity is thin, price could trade below the final presale level, for example $0.003–$0.006 (about $2.8–$5.6 million FDV).
Middle-ground scenario: If community traction holds and liquidity remains stable, price could revisit or modestly exceed upper presale stages, e.g., $0.009–$0.02 (about $8.4–$18.6 million FDV).
Higher-momentum scenario: If Token6900 captures outsized meme momentum and secures broader listings, a higher range is possible; an illustrative FDV of $20–$50 million implies roughly $0.021–$0.054 per token.
These ranges are not forecasts. Outcomes depend on market conditions, marketing execution, staking participation, and overall crypto sentiment around TGE and beyond. Participation in the Token6900 presale does not guarantee positive returns.
Conclusion
Token6900 is a meme-first ERC-20 token that makes its public sale the focal point, with a $5 million hard cap, stage-based pricing, and no private or venture allocations. The staking program—funded with 5% of supply and live from the start of the Token6900 presale—offers a way to accumulate additional T6900 before and after TGE, subject to a 30-day vesting period. Given the project’s lack of traditional utility, prospective participants should verify official links, understand the presale stages and staking terms, and recognize that price performance will largely track attention and liquidity. As with any crypto presale, conduct independent research and assess risk carefully before taking part in the Token6900 presale.
Disclaimer: The opinions expressed in this article are for informational purposes only. This article does not constitute an endorsement of any of the products and services discussed or investment, financial, or trading advice. Qualified professionals should be consulted prior to making financial decisions.
Bitget Academy2025-08-21 12:54
Sapien Price prediction 2025, 2026—2030: SAPIEN airdrop conversion, tokenomics, and outlook
TL;DR
TGE and price: Sapien’s SPN targets a 1,000,000,000 total supply with a public price of $0.003 per token (implied initial FDV of $3,000,000).
Airdrop conversion: Community tracking suggests points convert at roughly 72 points ≈ 1 SPN (estimate; subject to change). Airdrop unlocks over 4 months.
Quick math: Tokens ≈ points ÷ 72. At the $0.003 TGE price, 1,000 SPN ≈ $3.00 before market fluctuations and vesting.
Price predictions (range-only, not financial advice):
2025: $0.005–$0.04 (bear-to-bull range)
2026: $0.007–$0.07
2030: $0.02–$0.15
What is Sapien?
Sapien is an emerging crypto project introducing the Sapien token with a fixed total supply of 1 billion. The team’s documentation indicates a public sale price of $0.003, implying an initial fully diluted valuation of approximately $3 million. Prior to the token generation event (TGE), Sapien has run a points program that will convert to an Sapien airdrop. For authoritative details on design, allocation, and roadmap, review the official documentation at docs.sapien.io and the tokenomics. Understanding these sources is essential for anyone analyzing Sapien Price, because supply, unlocks, and utility strongly influence valuation.
Sapien airdrop: how points convert to SAPIEN and the unlock schedule
Community data suggests a provisional airdrop conversion close to 72 points equaling 1 SAPIEN. This estimate, surfaced by third‑party resources such as CryptoRank’s drophunting page, should be treated as indicative only until Sapien publishes the final allocation math. If the 72:1 ratio holds, a simple way to approximate your tokens is to divide your points by 72. For example, 72,000 points would imply roughly 1,000 SAPIEN; at the public price, that maps to a notional $3.00 before considering secondary market movements and vesting.
Source: Sapien Whitepaper
The airdrop will unlock over four months, which means holders should expect their SAPIEN to become transferable gradually rather than at once. A phased unlock can ease immediate sell pressure at TGE, though it still introduces predictable supply inflows. Traders watching Sapien Price should factor in this cadence, as unlock windows often coincide with increased volatility and shifts in order-book depth.
SAPIEN tokenomics, TGE, and why they matter for Sapien Price
At TGE, SAPIEN carries a total supply of 1,000,000,000 and a public price of $0.003. While the initial FDV computes to about $3,000,000, the more practical metric for Sapien Price in the short run is circulating supply at launch and across the first unlocks. The tokenomics paper will detail cliffs and vesting for core stakeholders, ecosystem incentives, and the community airdrop. Smaller initial float can amplify price discovery—both upward and downward—especially if liquidity is uneven across venues. As vesting progresses, incremental supply typically narrows spreads but may also weigh on Sapien Price unless accompanied by consistent demand.
Sapien Price prediction for 2025, 2026, and 2030
The following Sapien Price forecasts are scenario ranges informed by common patterns in early-stage tokens, expected liquidity, unlock schedules, and market cycle context. These are educational estimates, not financial advice.
In 2025, a conservative outcome could place Sapien Price in the $0.005–$0.01 zone if adoption is modest and unlock-driven selling persists. A more balanced path with improving liquidity, steady listings, and early product traction could support a range of $0.012–$0.025. Under favorable conditions—strong user retention, notable exchange listings, and supportive crypto market sentiment—Sapien Price could stretch to $0.03–$0.04.
By 2026, execution and utility should be clearer. If competition intensifies and growth slows, a $0.007–$0.02 band is plausible. With more mature product-market fit and most unlock overhang absorbed, Sapien Price might consolidate in a $0.02–$0.04 range. If Sapien expands real utility, increases demand sinks, and benefits from a constructive macro backdrop, an optimistic corridor of $0.05–$0.07 is conceivable.
Looking out to 2030, valuations depend on whether Sapien becomes a durable category player. In a cautious environment where only a handful of networks command premiums, Sapien Price could reside in a $0.02–$0.05 range. If the project sustains user growth and aligns token incentives with consistent utility, a $0.05–$0.10 base case is reasonable. Should Sapien achieve category leadership with strong on-chain metrics, deep liquidity, and ubiquitous listings, Sapien Price in the $0.10–$0.15 area is within historical precedent for successful early-stage tokens. All ranges are speculative and dependent on actual execution.
Key drivers that could influence Sapien Price
User growth and retention are the strongest long-term signals for Sapien Price. As daily and weekly active users rise and cohorts retain better, demand for utility tends to stabilize. Liquidity and exchange coverage also matter: deeper order books, market-making support, and Tier‑1 listings can reduce slippage and attract a broader investor base. On the supply side, the airdrop vesting, team and investor cliffs, and any ongoing emissions will shape near-term price behavior. If these unlocks coincide with low liquidity, volatility in Sapien Price can increase.
Utility is another cornerstone. Clear, repeatable use cases—such as governance, staking, in‑app benefits, or fee capture—can give holders reasons to keep SPN rather than sell on unlock. Execution against the roadmap, timely shipping of features, and credible communication are equally important. Finally, macro conditions and the crypto cycle set the backdrop for risk appetite; even strong fundamentals can be overshadowed in risk‑off markets, while bull cycles tend to compress risk premia and lift valuations.
Is SAPIEN a good investment?
SAPIEN is a high‑risk, early-stage token. The low initial FDV can provide room for re‑rating if adoption accelerates, and a points-to-airdrop funnel may seed an engaged user base that supports Sapien Price in the short term. Transparent unlocks help markets anticipate supply, but they can also create periodic sell pressure. Execution risk, competition, regulatory uncertainty, and overall market conditions may all influence returns. Treat SAPIEN as speculative, never invest more than you can afford to lose, and validate information directly from official sources.
Trade SAPIEN/USDT on Bitget!
Bitget Academy2025-08-21 12:44

API3 Token (API3) Price Prediction 2025, 2026-2030: Will API3 Reach $5, $10, or Higher?
API3 has become one of the more talked-about oracle projects in recent weeks, thanks to a dramatic price surge in mid-August 2025. The token nearly doubled in value, briefly trading above $2 after its listing on South Korea’s Upbit exchange. The new KRW and USDT trading pairs introduced a wave of liquidity and drew significant interest from traders, pushing API3 to its highest level in months.
This sudden rally has raised questions about what the future may hold. Can API3 sustain its momentum, or will it retrace as the hype cools down? Looking ahead to 2025 and beyond, investors are particularly curious whether API3 could realistically climb to $5, $10, or even higher. In this article, we explore what API3 is, why its price recently spiked, and how analysts are forecasting its trajectory from 2025 through 2030.
What Is API3?
API3 is a decentralized oracle network designed to connect real-world data with blockchain applications. In most oracle systems, data flows through third-party node operators before reaching a smart contract. API3 takes a different approach by promoting first-party oracles, where data providers run their own “Airnode” infrastructure. This design reduces reliance on intermediaries, improves transparency, and allows decentralized applications (dApps) to access data directly from the source.
The project was officially launched in late 2020 by Heikki Vänttinen, Burak Benligiray, and Saša Milić, who together envisioned a more reliable and decentralized way of delivering APIs to blockchains. Governance is handled through a decentralized autonomous organization (DAO), where API3 token holders vote on proposals and protocol decisions. The token also supports staking, which secures the network and aligns incentives among participants.
In addition to its oracle services, API3 rolled out the OEV Network in 2024, a system that allows DeFi protocols to capture and redistribute “oracle extractable value” (a variant of MEV). Analysts see this as a meaningful innovation that could strengthen API3’s position in the competitive oracle sector and support its long-term adoption.
API3’s Recent Rally: What Sparked the 100% Surge?
API3 Price
Source: CoinMarketCap
In August 2025, API3 experienced one of its sharpest rallies in recent memory. Between August 19 and 20, the token nearly doubled in price, climbing from around $0.9 to more than $1.83. The main driver behind this sudden surge was its listing on South Korea’s Upbit exchange, which introduced new KRW and USDT trading pairs.
Market sentiment also played a role. Prior to the listing, API3 had already shown signs of upward momentum, with smaller daily gains drawing the attention of traders. The broader demand for decentralized oracle solutions added fuel, as investors increasingly recognize the importance of reliable data feeds for DeFi applications. Analysts note that API3’s unique model of first-party oracles, along with innovations like the OEV Network, are helping distinguish it in a crowded sector.
Still, the rally carried signs of speculation. Technical indicators showed the token in overbought territory, and funding rates briefly turned negative as traders rushed in. After peaking above $1.83, API3 retraced to the low $1.30s, where it consolidated in the days that followed. The episode underscores both the excitement around API3’s potential and the volatility that often comes with sudden exchange-driven rallies.
2025 Price Prediction
Analysts hold mixed views on where API3 could head in 2025. Some expect only modest growth after its recent surge, while others believe strong market conditions and wider adoption could fuel much higher gains.
● Conservative outlook: Price range of $1.20–$2.00, with an average near $1.60.
● Moderate outlook: Forecasts place API3 in the $2.50–$3.00 range, averaging about $2.80.
● Bullish outlook: In the event of a major bull run, API3 could climb toward $8.00+, though this is considered unlikely without exceptional momentum.
2025 looks to be a pivotal year. If API3 maintains its technical progress and investor confidence, it could consolidate above $2 and possibly test higher ranges.
2026 Price Prediction
By 2026, API3’s outlook remains divided between cautious projections and more optimistic scenarios. Much depends on how the project’s technology is adopted within the DeFi ecosystem and the overall direction of the crypto market cycle.
● Conservative outlook: API3 could hover in the $1.60–$2.00 range, showing only gradual growth.
● Moderate outlook: Some forecasts see prices averaging around $3.40, with highs closer to $3.50.
● Bullish outlook: In a favorable market, API3 could move into the mid–single digits, breaking past previous highs.
In summary, 2026 could be a year of steady but uneven progress. While cautious models see limited upside, stronger adoption of API3’s solutions could position the token for more significant gains.
2027 Price Prediction
By 2027, projections for API3 begin to diverge more sharply. Some models anticipate only small gains from current levels, while others suggest stronger growth if DeFi adoption accelerates and API3’s oracle solutions gain wider traction.
● Conservative outlook: Average price near $1.70, with highs around $2.00.
● Moderate outlook: Estimates place API3 closer to $4.50–$5.00, reflecting steady ecosystem growth.
● Bullish outlook: If adoption expands significantly, API3 could climb into the upper single digits.
Taken together, 2027 looks like a year that could mark either consolidation or a breakout phase. Much will depend on whether API3 transitions from niche adoption to becoming a more widely used oracle solution.
2028 Price Prediction
By 2028, analysts see the potential for API3 to either continue its gradual climb or benefit from a more pronounced uptrend if DeFi usage expands meaningfully. Forecasts for this year show a wider spread, reflecting growing uncertainty the further out we look.
● Conservative outlook: Average price around $1.50–$2.00, with limited upside.
● Moderate outlook: API3 could trade near $5.50–$6.00, suggesting stronger adoption of its oracle services.
● Bullish outlook: In a highly favorable market, API3 may push into the $7–$8 range, marking significant long-term growth.
2028 could prove pivotal. A conservative path leaves API3 relatively flat, but deeper adoption of its technology could put the token within reach of higher single-digit prices.
2029–2030 Price Prediction
Looking toward 2029 and 2030, forecasts for API3 diverge even further. Some models expect only modest growth, while others anticipate more significant gains if the project strengthens its role in the DeFi ecosystem.
● Conservative outlook: API3 averages around $1.80–$2.40 in 2029 and roughly $2.00–$2.30 in 2030, showing only slow progress.
● Moderate outlook: Predictions place the token near $6.00 in 2029 and closer to $7.00 by 2030, reflecting steady adoption and favorable market cycles.
● Bullish outlook: In a highly optimistic scenario, API3 could exceed $10 by 2030 and potentially aim for even higher levels, though such targets are speculative.
By 2030, API3’s price path will likely depend on whether it has cemented itself as a core oracle provider or remained a niche project. The difference between modest growth and multi-fold gains underscores the uncertainty of long-term predictions.
Can API3 Hit $5?
For API3 to reach $5, the token would need to more than quadruple from its recent trading range. This target is ambitious, but not outside the realm of possibility. Moderate forecasts place API3 between $5 and $7 toward the end of the decade, suggesting that with steady adoption of its oracle technology and favorable market conditions, the milestone could be achieved.
Much will depend on whether API3 secures deeper integration across DeFi protocols and if its OEV Network gains meaningful traction. A strong crypto bull market could accelerate this process, pushing the token toward $5 earlier than expected. On the other hand, without sustained growth in demand, API3 may struggle to break past $3 in the near term.
Is It Possible for API3 to Hit $10 in 2030?
A $10 price target for API3 by 2030 is more ambitious than the $5 milestone, but not entirely out of reach. Achieving this level would require strong market conditions, continued expansion of DeFi, and widespread adoption of API3’s first-party oracle model. In this scenario, API3 would need to capture a larger share of the oracle market and sustain investor confidence through consistent innovation.
However, $10 remains a best-case scenario. Conservative projections keep API3 well below that level, closer to the $2–$7 range by 2030. While a bull market could push the token higher, reaching $10 would likely require both exceptional growth in the crypto sector and significant real-world demand for API3’s solutions. It is possible, but highly dependent on factors outside of API3’s control.
Conclusion
API3’s sharp rise in 2025 has put it back on the radar for many investors. Its approach to first-party oracles and the development of the OEV Network give it a unique position in the blockchain data market. Still, its future value will depend heavily on whether these solutions gain real traction beyond short-term trading momentum.
Price forecasts suggest a wide range of possible outcomes. Reaching $5 looks achievable within the next several years if adoption continues, while $10 by 2030 would require a strong bull market and much broader usage of its technology. For now, API3 remains a project with meaningful potential, but also with risks tied to market volatility and the uncertain pace of DeFi adoption.
Register now and explore the wonderful crypto world at Bitget!
Disclaimer: The opinions expressed in this article are for informational purposes only. This article does not constitute an endorsement of any of the products and services discussed or investment, financial, or trading advice. Qualified professionals should be consulted prior to making financial decisions.
Bitget Academy2025-08-20 16:56
Plume Price Prediction: Discover How Plume Turns LA Real Estate into Crypto and Delivers Rental Yields
As of August, 2025, the plume price is trading around $0.0821, showing a slight day-over-day dip, with an intraday range between roughly $0.0805 and $0.0876. Since its January 2025 IEO at $0.10, PLUME reached an all-time high of $0.247 in March 2025 and an all-time low of $0.07596 in June 2025. With approximately 2 billion tokens circulating out of a 10 billion total supply, the market capitalization is near $200 million.
In this article, we break down the current plume price, provide forecasts and trading history, and dive deep into how Plume is disrupting the real estate market by tokenizing Los Angeles commercial properties using cutting-edge blockchain technology.
What is Plume Network?
The plume price is influenced by a differentiated approach to real-world asset (RWA) tokenization. Plume focuses on converting productive assets—such as Los Angeles commercial real estate—into programmable, compliant tokens that can distribute income on-chain. This combination of legal alignment and automated servicing helps investors frame value beyond pure speculation.
Compliance Built into Tokens with ERC‑3643 (T‑REX)
Plume uses ERC‑3643 to embed transfer controls directly at the token layer. Wallet addresses are linked to on-chain identities, and claims such as KYC/AML status, jurisdiction, accreditation, and lock-up periods are checked before any transfer can settle. Because the rules live inside the token’s logic, issuers can enforce geo-fencing, per-investor limits, and corporate actions like forced transfers or redemptions. This makes the securities lifecycle auditable while preserving EVM composability—factors that can ultimately inform how the market prices risk and, by extension, the plume price.
Automated Income Distributions via Oracles and Automation
Rental income from tokenized properties can be routed to an on-chain distribution contract. Chainlink Automation can trigger scheduled payout cycles, while snapshot-based record dates fix holder balances for accurate allocations. Distributions can be executed in gas-efficient ways—such as Merkle-claim models for self-service or batched “push” payouts—often using stablecoins like USDC. Oracle feeds can also provide transparency where applicable, including NAV inputs or proof-of-reserve checks, improving confidence in cashflow integrity.
Reg A+ as a Pathway to Broader Participation
By leveraging the U.S. SEC’s Regulation A+ framework, issuers can market offerings broadly (subject to limits and reporting). On-chain registries map to transfer-agent responsibilities, and withholding or tax logic can be applied based on investor claims, aligning on-chain payouts with real-world obligations. This structure has been cited as achieving up to a 90× efficiency improvement over traditional servicing, a datapoint that can influence long-term perceptions of the plume price.
Case Study: LA Commercial Real Estate On-chain
Plume’s tokenization of Los Angeles commercial real estate showcases the full stack in action. Property interests are issued as ERC‑3643 tokens, investor eligibility is enforced programmatically, and rental income is distributed to token holders via automated, oracle-triggered cycles. With compliance features and auditability built into the token itself, issuers gain a single source of truth for their cap table while investors benefit from predictable, rules-based servicing.
What Moves the Plume Price?
Short-term movements in the plume price are often driven by liquidity conditions, token unlocks, exchange listings, and overall crypto market sentiment. Thin order books can amplify intraday swings, so depth and venue quality matter.
Over the medium term, the cadence and scale of new RWA deals, property performance, distribution reliability, and the breadth of permissioned liquidity venues can shape pricing.
Strong integrations with identity providers, custodians, payment partners, and oracle networks improve operational resilience and may reduce perceived risk. Clear smart-contract audits, multisig/MPC treasury controls, and timelocked admin policies further support confidence.
Plume Price Forecasts
Third-party outlooks vary. Some exchange commentaries suggest year-end ranges near $0.09 to $0.18 under typical conditions, while others model $0.20 to $0.30 assuming steady adoption and balanced token releases. A few outlier models propose higher upside scenarios tied to liquidity and issuance velocity.
Conclusion: Is Plume Price Set for Long-term Growth?
Plume’s pioneering approach to real asset tokenization, especially its success in converting LA real estate into legally compliant, income-distributing crypto, makes it one of the most watched projects in the RWA space. The plume price will reflect not only market speculation but also the project’s demonstrated ability to automate, scale, and deliver returns from real-world assets. Always research, confirm data, and understand your risk profile when evaluating the plume price as an investment option.
Bitget Academy2025-08-20 16:28
Pyth Network (PYTH) Price Prediction 2025, 2026–2030: Next Chainlink or Just Hype?
Blockchain smart contracts cannot access real-world information on their own. To execute effectively, they need reliable data about asset prices, financial markets, and other off-chain events. This critical function is handled by oracle networks, which serve as the bridge between blockchains and external data sources. Oracles have become an essential layer of infrastructure for decentralized finance (DeFi), derivatives, and the emerging world of tokenized assets.
For years, Chainlink (LINK) has been the dominant player in this space, trusted by major protocols and institutions. However, a new contender, Pyth Network (PYTH) , is gaining momentum with its high-frequency, real-time data feeds sourced directly from exchanges and trading firms. Backed by major industry participants and now featured in institutional products such as the Grayscale PYTH Trust, Pyth is positioning itself as a potential rival to Chainlink. For investors, the big question now is where Pyth’s price could be headed by 2030.
What Is Pyth Network (PYTH)?
Pyth Network is a decentralized oracle protocol launched in 2021 and developed by Jump Crypto, the blockchain arm of the well-known trading firm Jump Trading. It is designed to deliver real-time financial data to blockchains. While most oracles provide periodic price updates, Pyth Network specializes in high-frequency feeds sourced directly from leading exchanges, trading firms, and market makers. This approach reduces latency and aims to give decentralized applications access to more accurate and timely information, especially for fast-moving markets like derivatives, foreign exchange, and equities.
The network originally launched on Solana, leveraging its high-speed infrastructure to publish data with sub-second finality. Since then, Pyth has expanded rapidly and now supports dozens of blockchains across multiple ecosystems. Its architecture allows data providers to publish prices directly on-chain, while the network aggregates and verifies this information before making it available to smart contracts.
PYTH is the native token of the Pyth Network. It plays a role in governance, incentivizing participation, and securing the oracle system. As adoption grows, demand for PYTH could increase in parallel with usage of its data feeds. This model has positioned Pyth as a strong competitor in the oracle sector, with a value proposition built on speed, breadth of data, and institutional-grade sources.
Pyth Network in 2025: Growth, Challenges, and Outlook
Pyth Network (PYTH) Price
Source: CoinMarketCap
As of August 2025, Pyth Network (PYTH) has established itself as one of the fastest-growing oracle projects in the blockchain ecosystem. The token experienced significant volatility since its debut, reaching an all-time high near $1.15 in March 2024 before retracing sharply during broader market corrections. By mid-2025, PYTH trades in the $0.10–$0.15 range, with a market capitalization of roughly $650–$700 million. This decline from peak levels reflects challenging market conditions but also highlights the token’s resilience compared to many newer altcoins.
Pyth has also benefited from important institutional milestones. In November 2024, asset manager VanEck launched a PYTH-based exchange-traded note (ETN) in Europe, providing traditional investors exposure to the token. This was followed by Grayscale’s launch of the Pyth Network Trust in February 2025, further signaling confidence in Pyth’s role within blockchain infrastructure. On the adoption side, Pyth continues to expand aggressively, with more than 50 supported blockchains and hundreds of live data feeds ranging from crypto assets to equities and commodities.
Investor sentiment remains cautiously optimistic. While short-term price movements have been muted compared to competitors like Chainlink, the combination of institutional recognition, expanding data services, and deep integration within the Solana ecosystem suggests that Pyth is positioning itself for long-term relevance.
2025 Price Prediction
Looking ahead to the remainder of 2025, Pyth Network’s price trajectory will depend heavily on overall market conditions and adoption momentum.
● Bullish Scenario: If the broader crypto market stabilizes or enters a recovery phase, PYTH could benefit from renewed interest in oracle solutions. In this case, the token may climb into the $0.25–$0.35 range by year-end, supported by increased usage of its real-time data feeds.
● Bearish Scenario: Should market weakness persist, or if institutional products like the Grayscale PYTH Trust fail to attract meaningful inflows, PYTH could struggle to hold above $0.10. A drop toward the $0.07–$0.08 range would be possible under sustained selling pressure.
● Neutral/Consolidation Scenario: The most likely outcome may be a year of consolidation. In this case, PYTH would trade steadily within the $0.10–$0.20 range, with ecosystem growth laying the foundation for potential long-term gains.
2026 Price Prediction
By 2026, Pyth Network’s performance will hinge on whether it can continue expanding its integrations and attracting institutional support.
● Bullish Scenario: If Pyth strengthens its position as a go-to oracle for high-frequency data and expands partnerships beyond crypto into traditional finance, PYTH could see significant appreciation. In this case, the token may trade in the $0.50–$0.70 range.
● Bearish Scenario: A slowdown in adoption, lack of new partnerships, or ongoing market weakness could limit growth. Under these conditions, PYTH may remain capped around $0.10–$0.15, with potential dips toward $0.08 if investor sentiment turns negative.
● Neutral/Moderate Scenario: If progress continues steadily but without explosive growth, PYTH could maintain gradual upward momentum. A reasonable range in this scenario would be $0.25–$0.40.
2027 Price Prediction
By 2027, the oracle market could be more mature, and competition among providers may intensify. Pyth’s success will depend on how well it scales its technology and sustains its competitive edge in delivering institutional-grade data.
● Bullish Scenario: If adoption accelerates across both decentralized finance (DeFi) and tokenized traditional assets, PYTH could establish itself as a critical piece of blockchain infrastructure. In this case, prices may reach the $0.80–$1.20 range, potentially testing prior highs.
● Bearish Scenario: Should competing oracle solutions outpace Pyth or if user growth stalls, the token may struggle to maintain momentum. A bearish outcome could see PYTH trading between $0.15–$0.25, with limited investor interest.
● Neutral/Moderate Scenario: If Pyth grows at a steady pace but faces strong competition, the token could see moderate appreciation, consolidating in the $0.40–$0.60 range.
2028 Price Prediction
By 2028, blockchain adoption in traditional finance and tokenized assets could significantly expand the demand for reliable oracle services. Pyth’s ability to maintain its edge in speed and data quality will be key to determining its value.
● Bullish Scenario: If Pyth achieves deep integration across multiple blockchains and gains further institutional recognition, PYTH could surge into the $1.50–$2.00 range, establishing itself as one of the leading oracle tokens.
● Bearish Scenario: In the event that competing oracle providers dominate key markets or if blockchain adoption slows, PYTH may remain under pressure, with prices retracing to the $0.20–$0.30 range.
● Neutral/Moderate Scenario: With steady but unspectacular growth, Pyth could continue climbing gradually, trading in the $0.70–$1.00 range as it holds a solid position in the oracle sector.
2029 – 2030 Price Prediction
The closing years of the decade will be pivotal for Pyth Network as the blockchain industry matures and real-world use cases expand. By this point, success will depend on whether Pyth can sustain institutional trust and maintain its competitive advantage in delivering high-quality, low-latency data.
● Bullish Scenario: If decentralized finance continues to scale globally and tokenized traditional markets (such as equities and commodities) rely on oracles like Pyth, the token could see major appreciation. In this scenario, PYTH may trade between $2.50–$4.00 by 2030.
● Bearish Scenario: If Pyth fails to differentiate itself from rivals or blockchain adoption slows, growth potential could flatten. Under such conditions, PYTH might struggle in the $0.30–$0.50 range, remaining far below earlier projections.
● Neutral/Moderate Scenario: A balanced outcome would see Pyth grow steadily with the industry, retaining a role as a core oracle solution without dominating the market. Here, PYTH could consolidate in the $1.00–$1.80 range by 2030.
Conclusion
Pyth Network has established itself as a specialized oracle project with a focus on high frequency and institutional grade data. Since its launch, it has expanded across multiple blockchains, integrated with a wide range of protocols, and attracted attention from both the crypto community and traditional finance. These developments suggest that the project is steadily building its presence in a competitive market.
As the crypto industry moves closer to 2030, much will depend on how Pyth adapts to growing demand for reliable data, the pace of blockchain adoption, and the strength of its competition. Will Pyth ultimately emerge as a cornerstone of decentralized infrastructure, or will it remain a niche solution in an increasingly crowded field?
Register now and explore the wonderful crypto world at Bitget!
Disclaimer: The opinions expressed in this article are for informational purposes only. This article does not constitute an endorsement of any of the products and services discussed or investment, financial, or trading advice. Qualified professionals should be consulted prior to making financial decisions.
Bitget Academy2025-08-19 18:58
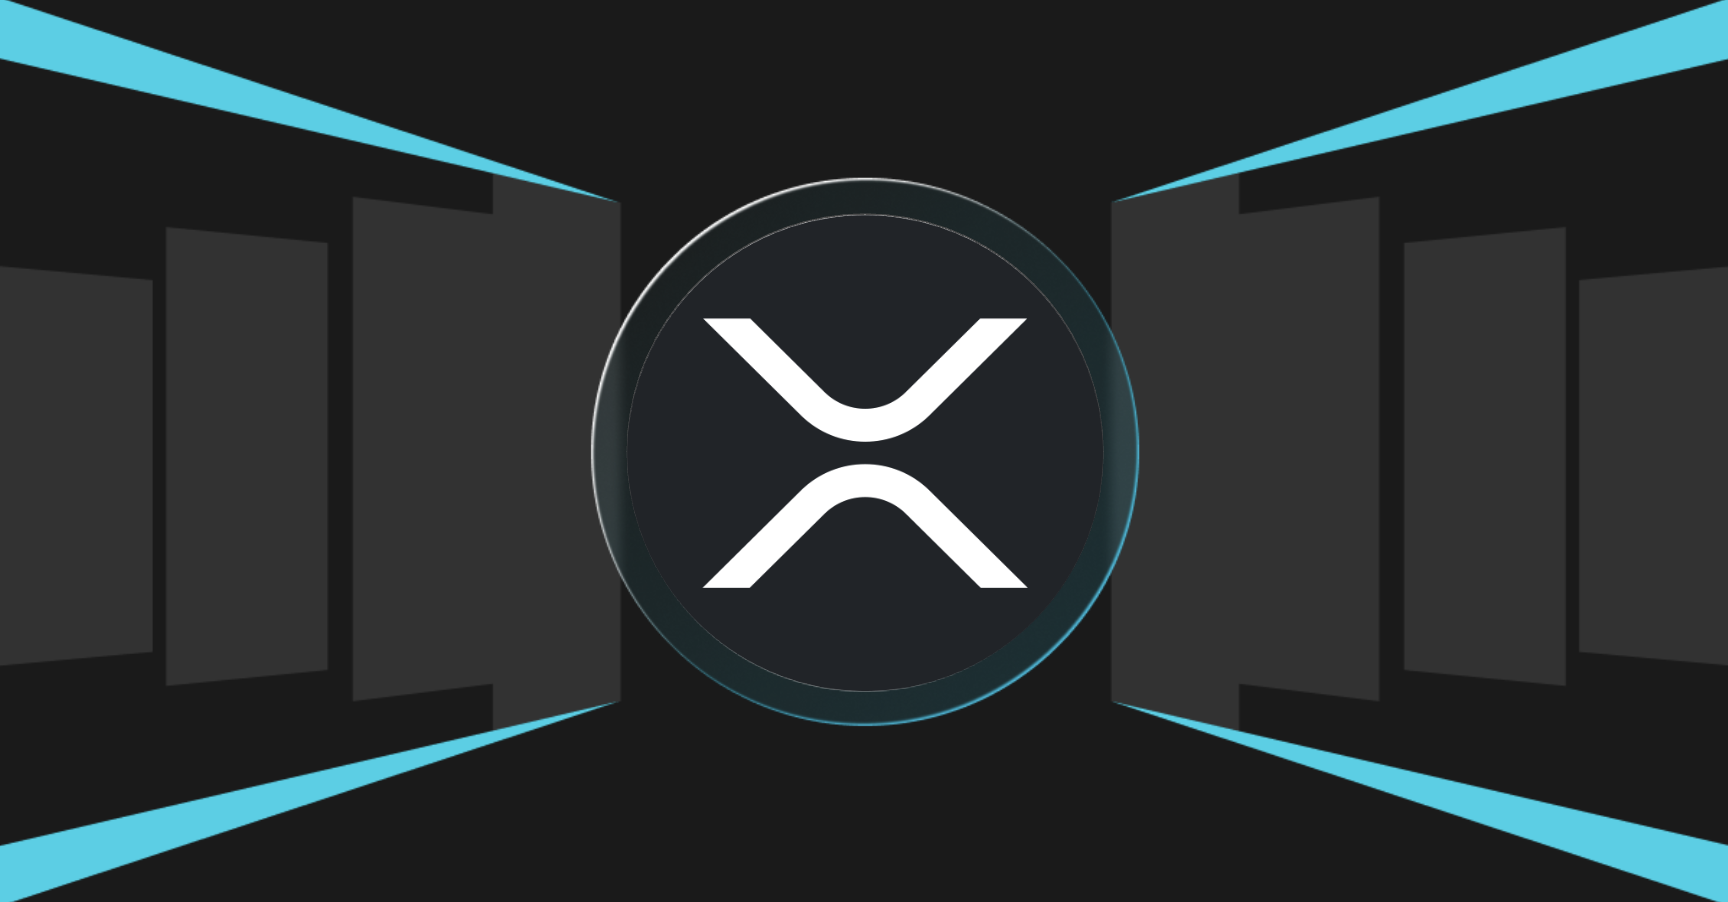
OpenAI’s ChatGPT 5 Turns Bullish: Why ETF Timing, and Gemini IPO Could Lift the XRP Price
The XRP price has been consolidating in the low-to-mid $3 range after a volatile summer, slipping beneath a key Fibonacci resistance zone near $3.43 and sitting roughly 40% below July’s local high around $3.64. Despite a sub‑50 RSI and a softening MACD histogram, liquidity has held up and on‑chain support remains concentrated near $2.81, where a notable round of accumulation last occurred. Headlines driving narrative include the SEC’s decision to push multiple spot crypto ETF rulings into an October window, as well as Gemini’s S‑1 disclosure of a revolving credit facility from Ripple that could utilize the XRP-linked RLUSD stablecoin as collateral. Meanwhile, whales reportedly accumulated about 900 million XRP within 48 hours, signaling conviction even as the XRP price failed to clear overhead resistance.
Using a structured, AI-assisted scenario exercise, OpenAI’s ChatGPT 5 produced a cautiously optimistic tilt into Q4, contingent on regulatory clarity and sustained post-event flows. In a favorable October outcome, the model’s path envisions an initial impulse toward the high‑$4s to low‑$5s, while its base case keeps the XRP price anchored above $3 until inflow data, brokerage access, and macro drivers confirm a broader trend. This analysis is educational in nature and does not constitute investment advice, nor is it an official forecast from OpenAI.
Why OpenAI’s ChatGPT 5 Is Bullishing XRP
ETF Delay
The SEC’s extension of spot crypto ETF reviews into October has been interpreted as procedural alignment with updated listing standards rather than a rejection signal. Historically, similar delays preceded approvals for Bitcoin and Ethereum ETFs, and a synchronized review window adds clarity for issuers and listing venues. OpenAI’s ChatGPT 5 views this timing as a net positive for the XRP price because it concentrates a catalyst into a defined period, keeps attention on inflow dynamics once decisions are made, and supports the notion that regulated access products can attract stickier institutional demand. In the near term, volatility remains possible, but the medium‑term structure looks more constructive if October brings definitive guidance.
Gemini IPO
Gemini’s S‑1 reveals a $75 million revolving credit facility from Ripple, expandable to $150 million, with potential borrowings in RLUSD, an XRP‑linked stablecoin. By placing XRP‑adjacent rails within a traditional corporate finance context, the filing elevates the utility narrative beyond speculative trading, toward credit, collateral, and liquidity management use cases. OpenAI’s ChatGPT 5 interprets this development as a direct bolster to fundamental demand drivers that can underpin the XRP price during risk‑on phases, especially if the IPO spotlight triggers similar partnerships and structured credit deals across the industry.
Whale Moves Defying Technical Weakness
Large‑wallet addresses reportedly accumulated approximately 900 million XRP—around $2.7 billion at recent marks—over a two‑day span, even as price action struggled below the $3.43 resistance area. This behavior suggests perceived value sub‑$3.50 and aligns with on‑chain support near $2.81, an area that anchored prior advances. Although momentum indicators remain mixed, OpenAI’s ChatGPT 5 assesses the accumulation as a constructive signal that could precondition the order book for upside follow‑through if a regulatory or flow‑based catalyst materializes, improving the probability that the XRP price can reclaim contested levels on rising volume.
What to Watch in October if Approval Happens
If an XRP‑related ETF receives approval, the most important indicator will be daily net inflows and the trajectory of assets under management. Sustained inflows over the first several weeks matter more than an outsized day‑one print. Distribution and access will be equally pivotal, as rapid availability on major brokerages and RIA platforms tends to unlock broader demand. Market plumbing warrants close monitoring too, including exchange liquidity, realized volumes on top venues, and the direction of large‑wallet transfers; movements to exchanges can signal supply, while migrations to custody often imply longer‑term holding. The macro backdrop and Bitcoin’s trend will set the beta environment; lower yields, a stable dollar, and a constructive BTC tape historically help altcoins capture upside. Technically, the XRP price should aim to hold above the 30‑day simple moving average near $3.07 and then reclaim $3.30–$3.43 with expanding volume to confirm momentum.
XRP Price Prediction by OpenAI’s ChatGPT 5 (AI‑Assisted Scenario Modeling)
In a bull case featuring October approval, persistent net inflows, swift brokerage distribution, and a supportive Bitcoin trend, OpenAI’s ChatGPT 5 maps a potential move toward the $4.50–$5.50 range within two to six weeks post‑decision. In a base case where approval is granted or the delay is constructive but access rolls out gradually and flow data are choppy, the XRP price would likely hold within $3.10–$3.80 through Q4, with weekly closes above $3.30 and then $3.43 needed to extend higher.
In a bear case involving outright rejection or prolonged delay alongside a risk‑off macro shift, the model envisions a retest toward $2.20–$2.80, with the $2.81 zone again serving as a critical battleground for buyers defending structure.
Bitget Academy2025-08-19 16:18
Buy GRT on Bitget in 3 simple steps

Sign up for a free Bitget account
Sign up on Bitget with your email address/mobile phone number and create a strong password to secure your account.

Verify your account
Verify your identity by entering your personal information and uploading a valid photo ID.

Buy GRT (GRT)
Use a variety of payment options to buy GRT on Bitget. We'll show you how.
Buy more crypto
How to buy
Bitcoin (BTC)

How to buy
Ethereum (ETH)

How to buy
Ripple (XRP)

How to buy
Tron (TRX)

How to buy
Dogecoin (DOGE)

How to buy
Tezo (XTZ)

How to buy
Bitget Token (BGB)

How to buy
Polygon (POL)

How to buy
Solana (SOL)

How to buy
Terra Classic (LUNC)

How to buy
Fantom (FTM)

How to buy
Bitcoin Cash (BCH)

How to buy
Ethereum Classic (ETC)

How to buy
Litecoin (LTC)

How to buy
Binance (BNB)

How to buy
Avalanche (AVAX)

How to buy
Internet Computer (ICP)

How to buy
Tether (USDT)

How to buy
USDC (USDC)

How to buy
Uniswap (UNI)

See more
Trending coin price predictions
 OFFICIAL TRUMP price prediction
 Ethereum price prediction
 Worldcoin price prediction
 dogwifhat price prediction
 Kaspa price prediction
 Smooth Love Potion price prediction
 Terra price prediction
 Shiba Inu price prediction
 Dogecoin price prediction
 Pepe price prediction
 Cardano price prediction
 Bonk price prediction
 Toncoin price prediction
 Pi price prediction
 Fartcoin price prediction
 Bitcoin price prediction
 Litecoin price prediction
 WINkLink price prediction
 Solana price prediction
 Stellar price prediction
Where can I buy The Graph (GRT)?
Given the inherent volatility and complexity of the cryptocurrency market, accurately predicting the future price of cryptocurrencies is virtually impossible. However, based on the cyclical nature of the market, historical price trends, long-term development outlook, and the potential for broader adoption, we can still make some general predictions about future price movements. At the same time, it should be noted that although these forecasts can provide insight into potential price ranges and scenarios, they should be viewed with caution and skepticism. Actual price movements are unlikely to align perfectly with these projections, and they should only be considered rough estimates of the market's investment potential.
This content provided is for informational purposes only and does not constitute an offer, solicitation of an offer, or a recommendation by Bitget to buy, sell, or hold any security, financial product, or instrument referenced in the content, nor does not constitute investment advice, financial advice, trading advice, or any other sort of advice. The data presented may reflect asset prices traded on the Bitget exchange as well as other cryptocurrency exchanges and market data platforms. Bitget may charge fees for the processing of cryptocurrency transactions, which may not be reflected in the conversion prices displayed. Bitget is not liable for any errors or delays in content or for any actions taken based on such content.
This content provided is for informational purposes only and does not constitute an offer, solicitation of an offer, or a recommendation by Bitget to buy, sell, or hold any security, financial product, or instrument referenced in the content, nor does not constitute investment advice, financial advice, trading advice, or any other sort of advice. The data presented may reflect asset prices traded on the Bitget exchange as well as other cryptocurrency exchanges and market data platforms. Bitget may charge fees for the processing of cryptocurrency transactions, which may not be reflected in the conversion prices displayed. Bitget is not liable for any errors or delays in content or for any actions taken based on such content.