PEPE Rebound in Progress? Harmonic Pattern Points to More Upside Move

Date: Sun, April 20, 2025 | 04:52 PM GMT
The cryptocurrency market has been under intense selling pressure recently, with Ethereum (ETH) posting its worst Q1 since 2018, sliding more than 45%. That bearish wave swept across the major memecoins— and the Pepe (PEPE) wasn’t spared either as it declined by 61% this year.
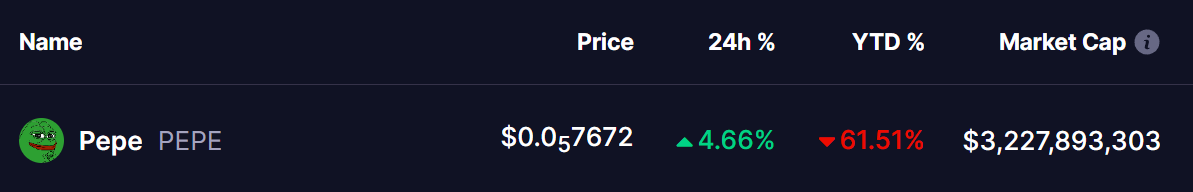 Source: Coinmarketcap
A classic harmonic pattern has emerged on the chart, hinting that PEPE could be gearing up for more upside in the near term.
Harmonic Pattern Suggests Continuation of the Rebound
The daily chart for PEPE shows the formation of a Bearish Gartley pattern, a structure that typically indicates a strong bullish move toward completion before any major reversal risk.
PEPE’s sharp decline began around February 14, after it failed to hold above the $0.00001075 resistance level (marked as point X). Since then, the memecoin lost nearly 50% of its value, eventually bottoming out near $0.0000052 on March 10 (point A).
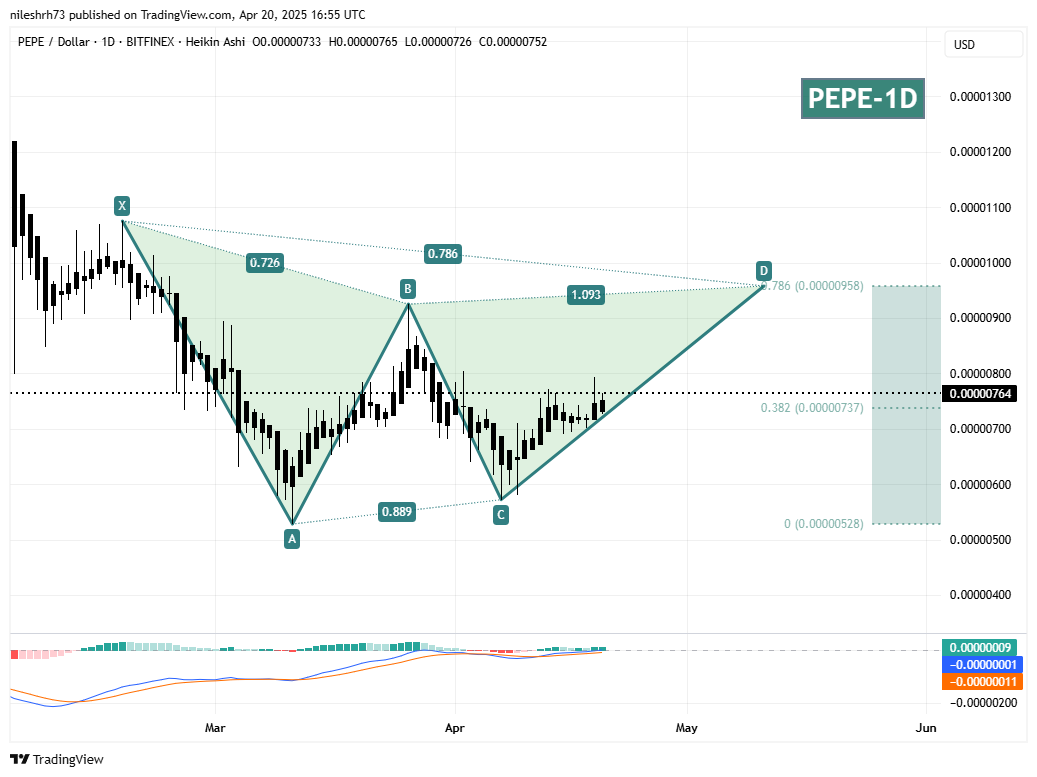 PEPE Daily Chart/ Coinsprobe (Source: Tradingview)
The recent price action suggests the token is now in the CD leg of the pattern, having made a strong bounce from $0.000005722 (point C), and is currently trading at $0.0000076 — the final wave that often precedes a significant short-term rally.
The next major target sits around 0.00000958, where point D completes the Gartley structure. If PEPE reaches this level from its current price near 0.00000764, it would mark a gain of approximately 25%.
What’s Next for PEPE?
If bullish momentum continues to gather strength, PEPE could climb toward the 0.00000958 zone in the coming days. This level not only completes the harmonic pattern but also lines up with the key 78.6% Fibonacci retracement of the X-A move — making it a critical resistance area to watch.
However, traders should stay cautious once PEPE nears this level. In harmonic trading, bearish reactions typically happen after reaching the D point, so profit-taking or a pullback could easily follow.
In the short term, the 0.00000737 area (38.2% Fib retracement) is acting as a minor support level .
Disclaimer: This article is for informational purposes only and does not constitute financial advice. Always do your own research before investing in cryptocurrencies.
Disclaimer: The content of this article solely reflects the author's opinion and does not represent the platform in any capacity. This article is not intended to serve as a reference for making investment decisions.
You may also like
Bitcoin: Crucial Metric Signals Bullish Momentum

Bitcoin Price Faces Crucial $97K Resistance, Glassnode On-Chain Data Reveals

Bitcoin Price Prediction: CryptoQuant CEO Signals Crucial Trend Shift Near $100K

Bitcoin analysts target $95K as Trump’s trade war cools — Do BTC futures agree?