Bitget Token (BGB) Forming a Bearish Pattern – Can Bulls Break the Structure?

Date: Thu, April 17, 2025 | 12:25 PM GMT
The cryptocurrency market has been navigating through turbulent waters in 2025. Ethereum (ETH), often a bellwether for broader market sentiment, suffered its worst Q1 since 2018 with a staggering 45% drop. This bearish momentum has rippled through altcoins —including centralized exchange tokens like Bitget Token (BGB), which has seen a 26% decline so far this year.
However, as BGB attempts to rebound, price action on the chart reveals a potentially critical technical setup that could dictate the token’s next move.
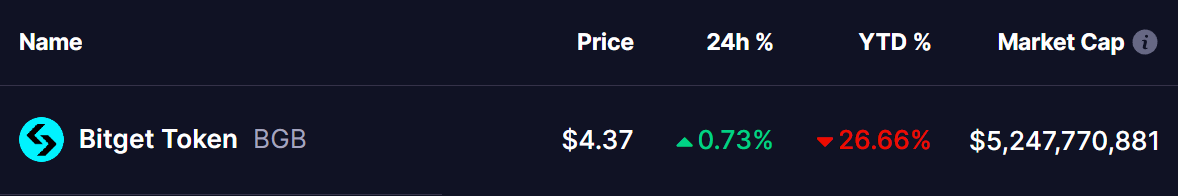 Source: Coinmarketcap
Is a Head and Shoulders Pattern in Play?
BGB is currently trading at $4.38, and a closer look at the daily chart suggests the formation of a head and shoulders pattern—a classic bearish setup that often precedes a trend reversal.
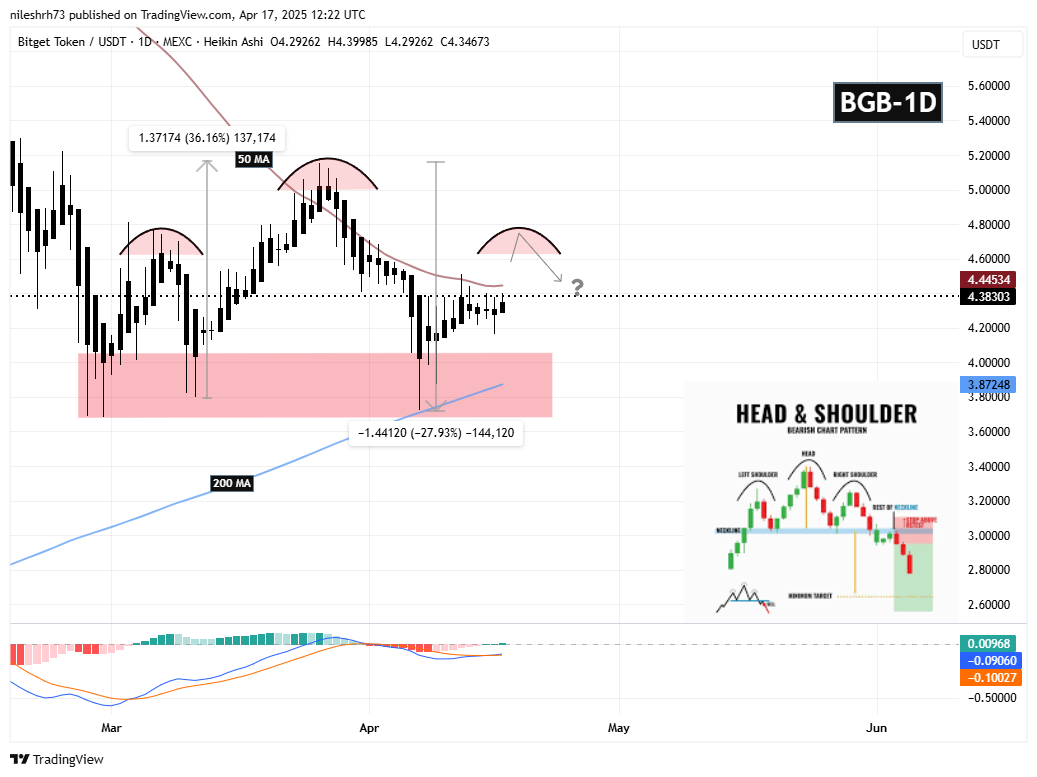 Bitget Token (BGB) Daily Chart/Coinsprobe (Source: Tradingview)
This formation began taking shape in early March after BGB faced rejection at $4.76, initiating a sharp decline that marked the left shoulder. A subsequent rally of 36% led to the formation of the head, peaking at $5.15. Following this, a swift drop of nearly 28% brought prices back down to the support zone between $3.70 and $4.05, effectively forming the neckline of the pattern.
Currently, BGB is showing signs of a recovery from this neckline zone. If the structure continues to play out, we might see another short-term rally back to the $4.76 region to complete the right shoulder. From there, technicals suggest a possible retracement toward the neckline support again. A confirmed breakdown below the neckline could validate the bearish structure, potentially triggering a deeper correction.
Looking under the hood, the MACD remains in a tight consolidation phase, with signals suggesting neutral momentum at present. Meanwhile, the 200-day moving average near the $3.87 level acts as dynamic support and could be a critical zone for bulls to defend in case of a breakdown.
The 50-day MA, currently sitting around $4.44, is acting as immediate resistance and aligns closely with the price target for the potential right shoulder.
What’s Ahead?
If bulls can invalidate the pattern by breaking above the $4.76 level with volume, it may trigger a broader recovery and put bears on the backfoot. However, failure to do so might accelerate downside pressure, potentially targeting the necline region.
Traders and investors should watch closely for price action near the neckline, as this zone could be the tipping point for BGB’s next major move.
Disclaimer: This article is for informational purposes only and not financial advice. Always conduct your own research before investing in cryptocurrencies.
Disclaimer: The content of this article solely reflects the author's opinion and does not represent the platform in any capacity. This article is not intended to serve as a reference for making investment decisions.
You may also like
Bitcoin's next big resistance is $95K— What will trigger the breakout?
Fed mouthpiece: Trump's comments will only make the job of the next Fed chairman more difficult
Ethereum developers plan to increase the gas limit by 4 times in the Fusaka hard fork