Pepe Price Prediction: PEPE Pumps 4% In A Week
The Pepe price is up over 4% on the weekly timeframe following a 2% pump in the last 24 hours to trade at $0.000008035 as of 11:45 p.m. EST as investors slowly start to buy into the meme coin.
Along with the uptick in the PEPE price in the last 24 hours, the crypto’s trading volume also surged 15% to above $808 million.
The Pepe Price Stuck In A Consolidation Phase
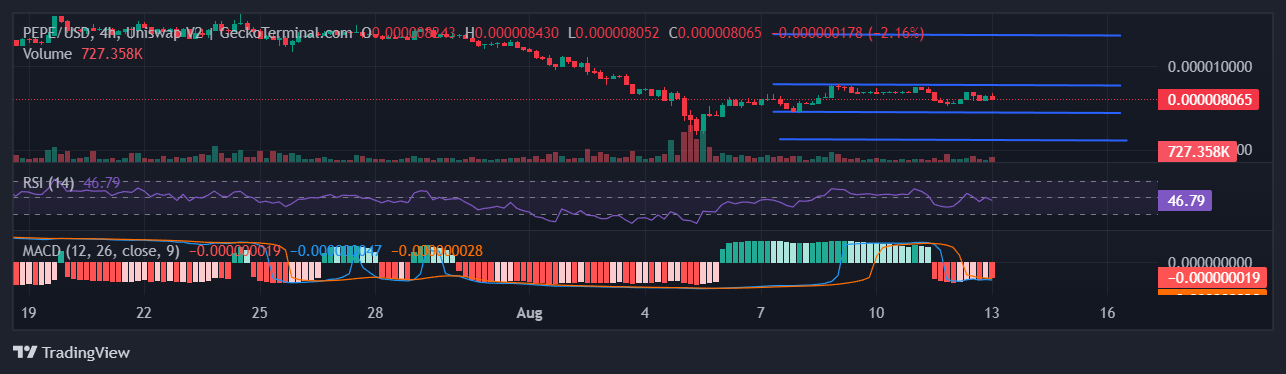
4-hour chart for PEPE/USD (Source: GeckoTerminal )
The Pepe price has been in a tight consolidation phase between $0.000007212 and $0.000008988 for the past couple of days. This period of sideways trading could be an accumulation phase before the meme coin enters a bullish move.
Should buyers decide to push PEPE up in the coming 48 hours, the crypto will likely attempt to flip the resistance level at $0.000008988 into support. A 4-hour candle close above this threshold might then give the Pepe price the technical foundation needed to rise to as high as $0.000011872 in the short term.
On the other hand, traders opting to dump the meme coin in the next few days could prevent the bullish thesis from happening. In this alternative scenario, the Pepe price might end up testing the immediate support level at $0.000007212. Continued sell pressure should PEPE drop to this point could then result in the crypto plunging to $0.000005585 in the following 24 hours.
Bearish Technicals Warn The Pepe Price Might Drop In The Short Term
Technical indicators on PEPE’s 4-hour chart show that bears currently have a slight upper hand over bulls. Both the Moving Average Convergence Divergence (MACD) and the Relative Strength Index (RSI) are showing negative signs. As such, the Pepe price might be at risk of dropping through the course of the next trading day.
The RSI line is currently below the major 50 benchmark. Traders usually see this as an indication of bearish strength. What’s more, the negative slope of the RSI line warns that sellers might be growing stronger against buyers, which could lead to a price drop if the technical sign is validated.
Meanwhile, the MACD line is positioned below the MACD Signal line on the 4-hour chart to indicate that PEPE is currently in a short-term bearish trend. However, the prior is starting to close in on the latter, which could be an early sign of the meme coin’s trend undergoing a bullish trend reversal.
Disclaimer: The content of this article solely reflects the author's opinion and does not represent the platform in any capacity. This article is not intended to serve as a reference for making investment decisions.
You may also like
Bitcoin analysts target $95K as Trump’s trade war cools — Do BTC futures agree?

Pepe Coin’s Price Might Surge as Key Resistance Levels Approach
In Brief James Wynn predicts short-term price increase for Pepe Coin based on technical indicators. Surpassing key price levels could initiate a recovery process. Investor confidence is growing following recent price movements in altcoin markets.

Fartcoin Surges as Investors Show Renewed Interest
In Brief Fartcoin has surged 107% in value over the past month. Market sentiment shows increasing interest despite volatility risks. Experts caution investors to be ready for potential price fluctuations.

Virtuals Protocol (VIRTUAL) to Continue Rebound? Key Harmonic Pattern Signaling a Upside Move