Bitget:全球日交易量排名前 4!
BTC 市占率62.63%
Bitget 新幣上架 : Pi Network
BTC/USDT$78290.18 (-4.94%)恐懼與貪婪指數23(極度恐懼)
山寨季指數:0(比特幣季)
盤前交易幣種BABY,PAWS,WCT比特幣現貨 ETF 總淨流量:-$64.9M(1 天);-$169.2M(7 天)。Bitget 新用戶立享 6,200 USDT 歡迎禮包!立即領取
到 Bitget App 隨時隨地輕鬆交易!立即下載
Bitget:全球日交易量排名前 4!
BTC 市占率62.63%
Bitget 新幣上架 : Pi Network
BTC/USDT$78290.18 (-4.94%)恐懼與貪婪指數23(極度恐懼)
山寨季指數:0(比特幣季)
盤前交易幣種BABY,PAWS,WCT比特幣現貨 ETF 總淨流量:-$64.9M(1 天);-$169.2M(7 天)。Bitget 新用戶立享 6,200 USDT 歡迎禮包!立即領取
到 Bitget App 隨時隨地輕鬆交易!立即下載
Bitget:全球日交易量排名前 4!
BTC 市占率62.63%
Bitget 新幣上架 : Pi Network
BTC/USDT$78290.18 (-4.94%)恐懼與貪婪指數23(極度恐懼)
山寨季指數:0(比特幣季)
盤前交易幣種BABY,PAWS,WCT比特幣現貨 ETF 總淨流量:-$64.9M(1 天);-$169.2M(7 天)。Bitget 新用戶立享 6,200 USDT 歡迎禮包!立即領取
到 Bitget App 隨時隨地輕鬆交易!立即下載


Wormhole 價格W
上架
報價幣種:
TWD
NT$2.47-4.96%1D
價格走勢圖
TradingView
最近更新時間 2025-04-07 16:38:43(UTC+0)
市值:NT$11,191,564,299.33
完全稀釋市值:NT$11,191,564,299.33
24 小時交易額:NT$3,208,644,967.8
24 小時交易額/市值:28.67%
24 小時最高價:NT$2.58
24 小時最低價:NT$2.22
歷史最高價:NT$53.07
歷史最低價:NT$2.22
流通量:4,525,914,600 W
總發行量:
10,000,000,000W
流通率:45.00%
最大發行量:
--W
以 BTC 計價:0.{6}9575 BTC
以 ETH 計價:0.{4}4848 ETH
以 BTC 市值計價:
以 ETH 市值計價:
合約:
0xB0fF...87b2b91(Arbitrum)
更多
您今天對 Wormhole 感覺如何?
注意:此資訊僅供參考。
Wormhole 今日價格
Wormhole 的即時價格是今天每 (W / TWD) NT$2.47,目前市值為 NT$11.19B TWD。24 小時交易量為 NT$3.21B TWD。W 至 TWD 的價格為即時更新。Wormhole 在過去 24 小時內的變化為 -4.96%。其流通供應量為 4,525,914,600 。
W 的最高價格是多少?
W 的歷史最高價(ATH)為 NT$53.07,於 2024-04-03 錄得。
W 的最低價格是多少?
W 的歷史最低價(ATL)為 NT$2.22,於 2025-04-07 錄得。
Wormhole 價格預測
什麼時候是購買 W 的好時機? 我現在應該買入還是賣出 W?
在決定買入還是賣出 W 時,您必須先考慮自己的交易策略。長期交易者和短期交易者的交易活動也會有所不同。Bitget W 技術分析 可以提供您交易參考。
根據 W 4 小時技術分析,交易訊號為 賣出。
根據 W 1 日技術分析,交易訊號為 強力賣出。
根據 W 1 週技術分析,交易訊號為 強力賣出。
W 在 2026 的價格是多少?
根據 W 的歷史價格表現預測模型,預計 W 的價格將在 2026 達到 NT$3.1。
W 在 2031 的價格是多少?
2031,W 的價格預計將上漲 +27.00%。 到 2031 底,預計 W 的價格將達到 NT$5,累計投資報酬率為 +91.67%。
Wormhole 價格歷史(TWD)
過去一年,Wormhole 價格上漲了 -92.75%。在此期間,W 兌 TWD 的最高價格為 NT$34.42,W 兌 TWD 的最低價格為 NT$2.22。
時間漲跌幅(%) 最低價
最低價 最高價
最高價 
 最低價
最低價 最高價
最高價 
24h-4.96%NT$2.22NT$2.58
7d-9.75%NT$2.22NT$3.05
30d-24.24%NT$2.22NT$4.28
90d-73.56%NT$2.22NT$9.02
1y-92.75%NT$2.22NT$34.42
全部時間-94.57%NT$2.22(2025-04-07, 今天 )NT$53.07(2024-04-03, 1 年前 )
Wormhole 市場資訊
Wormhole 行情
Wormhole 持幣
Wormhole 持幣分布矩陣
Wormhole 持幣分布集中度
巨鯨
投資者
散戶
Wormhole 地址持有時長分布
長期持幣者
游資
交易者
coinInfo.name(12)即時價格表

Wormhole 評級
社群的平均評分
4.4
此內容僅供參考。
W 兌換當地法幣匯率表
1 W 兌換 MXN$1.561 W 兌換 GTQQ0.581 W 兌換 CLP$73.811 W 兌換 UGXSh278.711 W 兌換 HNLL1.921 W 兌換 ZARR1.461 W 兌換 TNDد.ت0.231 W 兌換 IQDع.د98.241 W 兌換 TWDNT$2.471 W 兌換 RSDдин.81 W 兌換 DOP$4.711 W 兌換 MYRRM0.341 W 兌換 GEL₾0.211 W 兌換 UYU$3.161 W 兌換 MADد.م.0.711 W 兌換 AZN₼0.131 W 兌換 OMRر.ع.0.031 W 兌換 SEKkr0.751 W 兌換 KESSh9.711 W 兌換 UAH₴3.08
- 1
- 2
- 3
- 4
- 5
最近更新時間 2025-04-07 16:38:43(UTC+0)
如何購買 Wormhole(W)

建立您的免費 Bitget 帳戶
使用您的電子郵件地址/手機號碼在 Bitget 註冊,並建立強大的密碼以確保您的帳戶安全

認證您的帳戶
輸入您的個人資訊並上傳有效的身份照片進行身份認證

將 Wormhole 兌換為 W
我們將為您示範使用多種支付方式在 Bitget 上購買 Wormhole
了解更多交易 W 永續合約
在 Bitget 上註冊並購買 USDT 或 W 後,您可以開始交易衍生品,包括 W 合約和槓桿交易,增加收益。
W 的目前價格為 NT$2.47,24 小時價格變化為 -4.96%。交易者可透過做多或做空 W 合約獲利。
Wormhole 動態

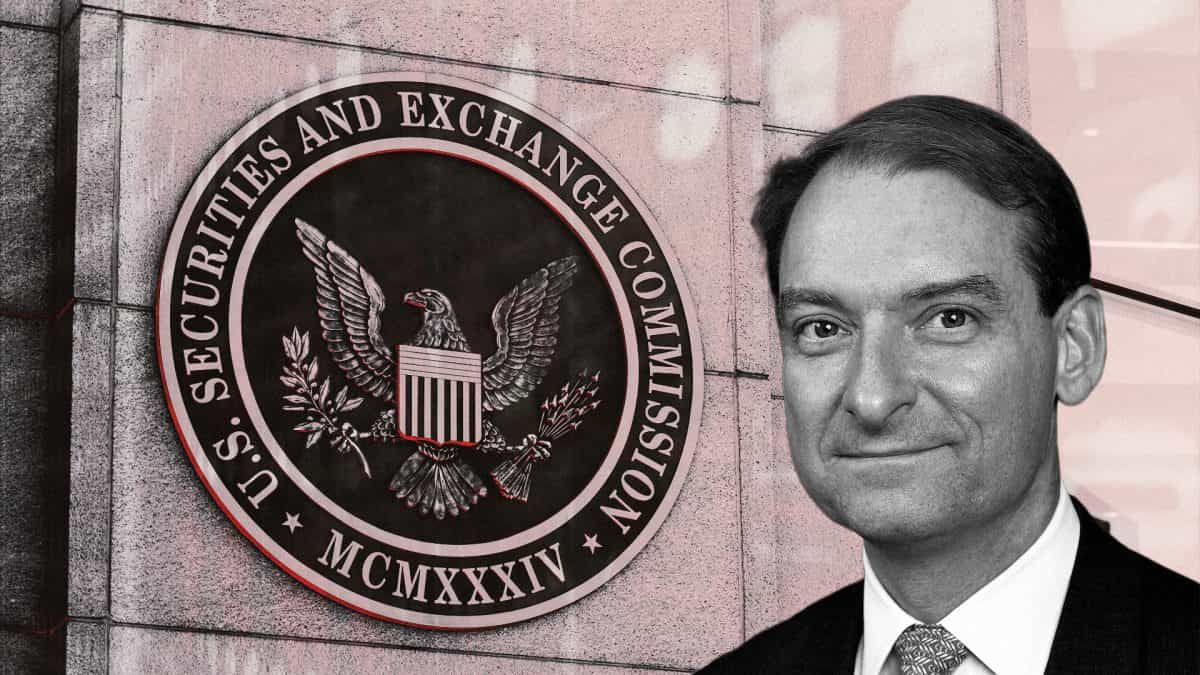
川普提名 Paul Atkins 出任美國 SEC 主席,參院銀行委員會表決通過
Blockcast•2025-04-04 11:11

Wormhole治理即將上線,未來將專注於多鏈治理解決方案
Bitget•2025-04-04 01:48

參議院銀行委員會投票推進特朗普提名保羅·阿特金斯擔任證券交易委員會主席
簡要概述 唐納德·特朗普總統於12月任命阿特金斯領導美國證券交易委員會。阿特金斯於2009年創立了顧問公司Patomak Global Partners。該公司擁有包括銀行、加密貨幣交易所和去中心化金融平台在內的客戶。
The Block•2025-04-03 17:12

數據:SUI、W、ENA等代幣將於下周迎來大額解鎖,其中SUI解鎖價值約1.52億美元
Panews•2025-03-30 05:23

參議員質詢證交會提名人保羅·阿特金斯,關於其與FTX的關聯及該機構在根斯勒領導下的失誤
簡要概述 參議院銀行委員會主席提姆·斯科特(Tim Scott,南卡羅來納州共和黨)詢問保羅·阿特金斯(Paul Atkins)關於該機構如何從參議員所描述的涉及如Debt Box等法院案件的損失中恢復。參議員約翰·肯尼迪(John Kennedy,路易斯安那州共和黨)迅速向阿特金斯提出關於美國證券交易委員會(SEC)對山姆·班克曼-弗里德(Sam Bankman-Fried)父母計劃採取何種行動的問題。聽證會還包括其他提名人,立法者對加密貨幣的提問不多。
The Block•2025-03-28 01:22
購買其他幣種
用戶還在查詢 Wormhole 的價格。
Wormhole 的目前價格是多少?
Wormhole 的即時價格為 NT$2.47(W/TWD),目前市值為 NT$11,191,564,299.33 TWD。由於加密貨幣市場全天候不間斷交易,Wormhole 的價格經常波動。您可以在 Bitget 上查看 Wormhole 的市場價格及其歷史數據。
Wormhole 的 24 小時交易量是多少?
在最近 24 小時內,Wormhole 的交易量為 NT$3.21B。
Wormhole 的歷史最高價是多少?
Wormhole 的歷史最高價是 NT$53.07。這個歷史最高價是 Wormhole 自推出以來的最高價。
我可以在 Bitget 上購買 Wormhole 嗎?
可以,Wormhole 目前在 Bitget 的中心化交易平台上可用。如需更詳細的說明,請查看我們很有幫助的 如何購買 wormhole 指南。
我可以透過投資 Wormhole 獲得穩定的收入嗎?
當然,Bitget 推出了一個 策略交易平台,其提供智能交易策略,可以自動執行您的交易,幫您賺取收益。
我在哪裡能以最低的費用購買 Wormhole?
Bitget提供行業領先的交易費用和市場深度,以確保交易者能够從投資中獲利。 您可通過 Bitget 交易所交易。
您可以在哪裡購買 Wormhole(W)?
影片部分 - 快速認證、快速交易

如何在 Bitget 完成身分認證以防範詐騙
1. 登入您的 Bitget 帳戶。
2. 如果您是 Bitget 的新用戶,請觀看我們的教學,以了解如何建立帳戶。
3. 將滑鼠移到您的個人頭像上,點擊「未認證」,然後點擊「認證」。
4. 選擇您簽發的國家或地區和證件類型,然後根據指示進行操作。
5. 根據您的偏好,選擇「手機認證」或「電腦認證」。
6. 填寫您的詳細資訊,提交身分證影本,並拍攝一張自拍照。
7. 提交申請後,身分認證就完成了!
加密貨幣投資(包括透過 Bitget 線上購買 Wormhole)具有市場風險。Bitget 為您提供購買 Wormhole 的簡便方式,並且盡最大努力讓用戶充分了解我們在交易所提供的每種加密貨幣。但是,我們不對您購買 Wormhole 可能產生的結果負責。此頁面和其包含的任何資訊均不代表對任何特定加密貨幣的背書認可,任何價格數據均採集自公開互聯網,不被視為來自Bitget的買賣要約。
Bitget 觀點

₵ryptoXpert
20小時前
🦅How I Made $160 Yesterday by Reading 5-Minute🦅😱 Candlestick Patterns😳👀
⚡ Fast Charts, Smart Trades, Real Profits
Yesterday,I pulled in $160—not by taking wild risks,but by reading 5-minute candlestick charts and spotting high-probability setups in real time. No fluff, no FOMO—just clean analysis and quick execution.
🔥 Bullish Patterns – Catch the Bounce Before It Rips
These patterns show up after a pullback, signaling that buyers are stepping in:
✅ Inverted Head & Shoulders – 💡 A powerful reversal pattern that starts an uptrend.
✅ Double Bottom – 🔄 The ‘W’ shape signals strong support, suggesting a move higher.
✅ Bullish Flag – 🚀 A brief pause before the next leg up.
✅ Triple Bottom – 📈 Price tests support three times before a sharp move upward.
✅ Cup & Handle – 🍵 A smooth base and handle, leading to a breakout.
🧐 Indecision Patterns – Don’t Jump, Just Watch
These patterns build pressure—wait for confirmation before entering:
⚖️ Symmetrical Triangle – Price coils tightly—breakout can go either way.
🔻 Falling Wedge – Looks bearish but often breaks up.
🔺 Rising Wedge – A bearish tilt, but can flip bullish.
📉 Descending Triangle – Bearish, but prone to fake breakouts upward.
📈 Ascending Triangle – Bullish momentum building—watch for breakout above resistance.
🚨 Bearish Patterns – Know When to Let Go or Short
These signal weakness—perfect for securing profits or shorting:
🚫 Head & Shoulders – Reversal pattern signaling the trend is over.
🚨 Triple Top – Price rejected three times—time to exit or short.
⚠️ Double Top – An upside-down ‘W’ means bulls are losing control.
📉 Bearish Flag – A fake rally in a downtrend, usually breaks lower.
🎯 Pro Moves That Helped Me Book $160
💎 Bullish Setup – Jump in early with a tight stop.
📉 Bearish Setup – Exit fast or short for a quick gain.
⏳ Indecision – Wait for confirmation before risking a dollar.
The 5-minute chart is fast and sharp—but with the right mindset and pattern recognition, it pays off. Yesterday, it handed me $160. Learn to read the charts, spot the setups, and let the market’s patterns guide your profits! 🚀🔥
MOVE+2.71%
ME+0.75%

CryptoStrategyBasic
21小時前
DOGE/USDT Market Strategy & Prediction
Current Overview:
Price: 0.15276 USDT (-9.24%)
24h Range: 0.15066 – 0.16998
MACD, EMA, and KD indicators confirm bearish momentum
Volume surge indicates heightened activity near support
Short-Term Strategy (1h - 4h):
1. Watch Support at 0.150–0.151: If this zone holds, expect a short-term rebound to 0.158–0.160.
2. Break Below 0.150: Could trigger another dip toward 0.145.
3. Look for Bullish Candles on Heikin Ashi: They often appear before trend reversals.
Mid-Term Strategy (1D - 1W):
EMA Trend: Downward EMAs (5, 10, 20) suggest continued sell pressure.
Volume Analysis: Sudden spike may indicate accumulation by larger players.
If price stabilizes above 0.158, we may see a recovery to 0.165.
Otherwise, expect consolidation between 0.145–0.155.
Refined Prediction (Using Multiple Timeframes):
1H chart: Oversold on RSI & stochastic indicators; minor bounce likely.
4H chart: Heikin Ashi still red; trend remains bearish.
1D chart: Trend forming a base near 0.150.
Summary: DOGE is under pressure but approaching a psychological and technical support. Reversal signals like bullish Heikin Ashi candles or MACD crossover should be closely monitored. Ideal for short scalps or accumulation if holding long-term.
$DOGE
RED+6.06%
DOGE-1.65%
BGUSER-XD4XYH2W
21小時前
https://www.bitget.com/referral/register?clacCode=XD4XYH2W&from=%2Fevents%2Freferral-all-program&source=events&utmSource=PremierInviter
W+1.62%
Amal777
1天前
Yesterday, I walked away with $160 profit not from some wild gamble, but by reading 5-minute candles
Yesterday, I walked away with $160 profit not from some wild gamble, but by reading 5-minute candlestick charts and recognizing high-probability setups in real time. It’s all about timing, structure, and knowing exactly what to look for. No fluff, no FOMO just clean chart analysis and fast execution. Once you master these patterns, you’ll start spotting opportunities others miss.
1. Bullish Patterns – Catch the Bounce Before It Rips
These show up after a pullback, hinting that buyers are gearing up:
Inverted Head & Shoulders: A strong reversal pattern that kicks off an uptrend.
Double Bottom: That ‘W’ shape means price found solid support — likely heading higher.
Bullish Flag: A pause in an uptrend that reloads for the next leg up.
Triple Bottom: Price tests support three times before exploding upward.
Cup & Handle: Smooth rounded base followed by a handle — classic breakout setup.
2. Indecision Patterns – Don’t Jump, Just Watch
These patterns build pressure — you wait for a clean breakout to confirm direction:
Symmetrical Triangle: Price coils tightly — breakout could go either way.
Falling Wedge: Looks bearish but often breaks to the upside.
Rising Wedge: A bearish tilt, but occasionally surprises with a bullish flip.
Descending Triangle: Bearish bias, but not uncommon to fake out and break upward.
Ascending Triangle: Bullish energy building — just wait for the breakout above resistance.
3. Bearish Patterns – Know When to Let Go or Short
These signal weakness — great for locking in profits or riding the downside:
Head & Shoulders: A reversal pattern that screams “trend is done” once the neckline breaks.
Triple Top: Price gets rejected three times — time to back out or short.
Double Top: An upside-down ‘W’ signaling bulls are done running.
Bearish Flag: A fake rally during a downtrend — usually breaks lower.
Pro Moves That Helped Me Book $160:
Spot a bullish setup? I jumped in early with a tight stop.
Caught a bearish pattern? I either exited fast or shorted for a quick gain.
Saw confusion? I waited for confirmation before risking a single dollar.
The 5-minute chart is fast and furious — but with the right mindset and pattern play, it can pay big. Yesterday, it handed me $160. Learn to read what the market’s telling you… and let the patterns guide your profits
$BTC $PI
BTC-0.11%
ME+0.75%

CryptoGuider
1天前
How I Made $160 Yesterday by Reading 5-Minute Candlestick Patterns – Fast Charts, Smart Trades, Real
Yesterday, I walked away with $160 profit not from some wild gamble, but by reading 5-minute candlestick charts and recognizing high-probability setups in real time. It’s all about timing, structure, and knowing exactly what to look for. No fluff, no FOMO just clean chart analysis and fast execution. Once you master these patterns, you’ll start spotting opportunities others miss.
1. Bullish Patterns – Catch the Bounce Before It Rips
These show up after a pullback, hinting that buyers are gearing up:
Inverted Head & Shoulders: A strong reversal pattern that kicks off an uptrend.
Double Bottom: That ‘W’ shape means price found solid support — likely heading higher.
Bullish Flag: A pause in an uptrend that reloads for the next leg up.
Triple Bottom: Price tests support three times before exploding upward.
Cup & Handle: Smooth rounded base followed by a handle — classic breakout setup.
2. Indecision Patterns – Don’t Jump, Just Watch
These patterns build pressure — you wait for a clean breakout to confirm direction:
Symmetrical Triangle: Price coils tightly — breakout could go either way.
Falling Wedge: Looks bearish but often breaks to the upside.
Rising Wedge: A bearish tilt, but occasionally surprises with a bullish flip.
Descending Triangle: Bearish bias, but not uncommon to fake out and break upward.
Ascending Triangle: Bullish energy building — just wait for the breakout above resistance.
3. Bearish Patterns – Know When to Let Go or Short
These signal weakness — great for locking in profits or riding the downside:
Head & Shoulders: A reversal pattern that screams “trend is done” once the neckline breaks.
Triple Top: Price gets rejected three times — time to back out or short.
Double Top: An upside-down ‘W’ signaling bulls are done running.
Bearish Flag: A fake rally during a downtrend — usually breaks lower.
Pro Moves That Helped Me Book $160:
Spot a bullish setup? I jumped in early with a tight stop.
Caught a bearish pattern? I either exited fast or shorted for a quick gain.
Saw confusion? I waited for confirmation before risking a single dollar.
The 5-minute chart is fast and furious — but with the right mindset and pattern play, it can pay big. Yesterday, it handed me $160. Learn to read what the market’s telling you… and let the patterns guide your profits
$BTC $PI
BTC-0.11%
ME+0.75%
相關資產
最近新增
最近新增的加密貨幣
相近市值
在所有 Bitget 資產中,這8種資產的市值最接近 Wormhole。


Wormhole 社群媒體數據
過去 24 小時,Wormhole 社群媒體情緒分數是 3.3,社群媒體上對 Wormhole 價格走勢偏向 看漲。Wormhole 社群媒體得分是 135,544,在所有加密貨幣中排名第 37。
根據 LunarCrush 統計,過去 24 小時,社群媒體共提及加密貨幣 1,058,120 次,其中 Wormhole 被提及次數佔比 0.03%,在所有加密貨幣中排名第 77。
過去 24 小時,共有 1,158 個獨立用戶談論了 Wormhole,總共提及 Wormhole 304 次,然而,與前一天相比,獨立用戶數 增加 了 14%,總提及次數增加。
Twitter 上,過去 24 小時共有 9 篇推文提及 Wormhole,其中 22% 看漲 Wormhole,0% 篇推文看跌 Wormhole,而 78% 則對 Wormhole 保持中立。
在 Reddit 上,最近 24 小時共有 0 篇貼文提到了 Wormhole,相比之前 24 小時總提及次數 減少 了 0%。
社群媒體資訊概況
3.3