Bitcoin Price Watch: Momentum Cools but Uptrend Remains Intact

Bitcoin traded at $118,434 on July 19, 2025, with a total market capitalization of $2.35 trillion. Over the last 24 hours, it moved within an intraday range of $117,010 to $119,529, generating a trade volume of $42.72 billion.
Bitcoin
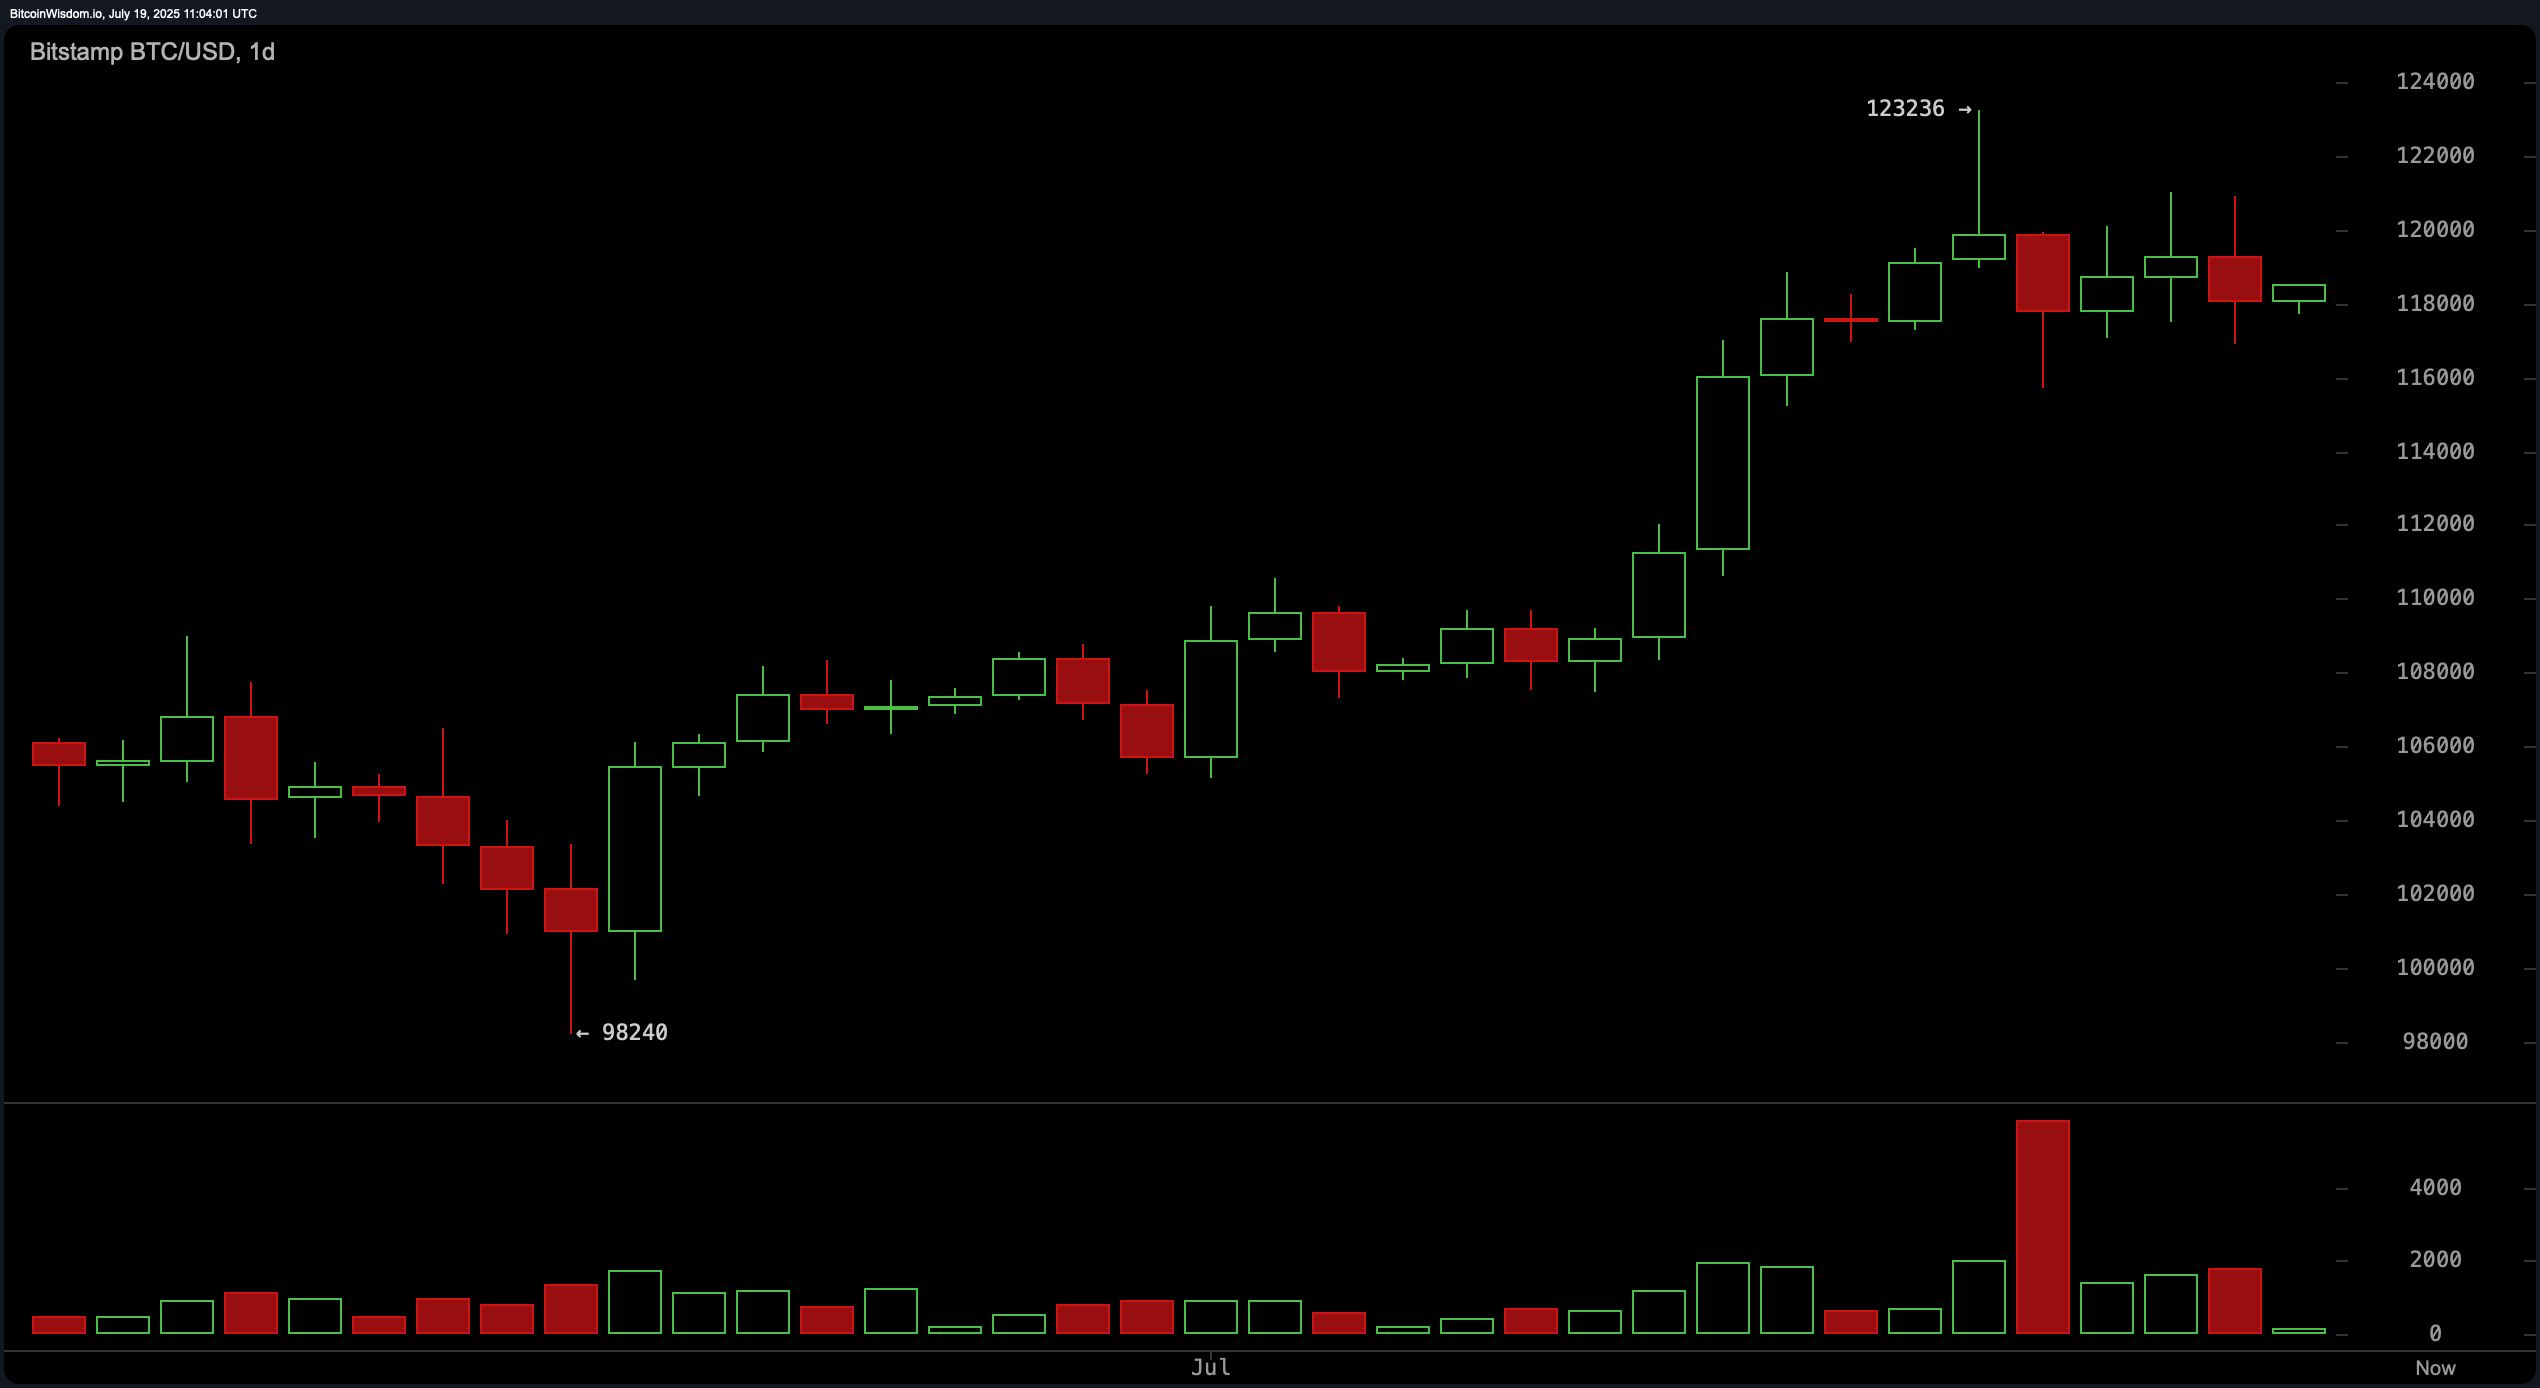
From a daily chart perspective, bitcoin exhibited a pronounced bullish structure as it advanced from below $100,000 to a peak near $123,236 before entering a mild consolidation phase. The presence of a high-volume bearish engulfing candle near the top suggests potential short-term exhaustion, indicating that some traders are engaging in profit-taking. Despite this, the pattern of higher highs and higher lows remains technically intact. A support zone appears near the $115,000 to $116,000 range, offering a potential re-entry level for medium-term buyers, while the $122,000 to $123,000 range serves as a likely resistance level.
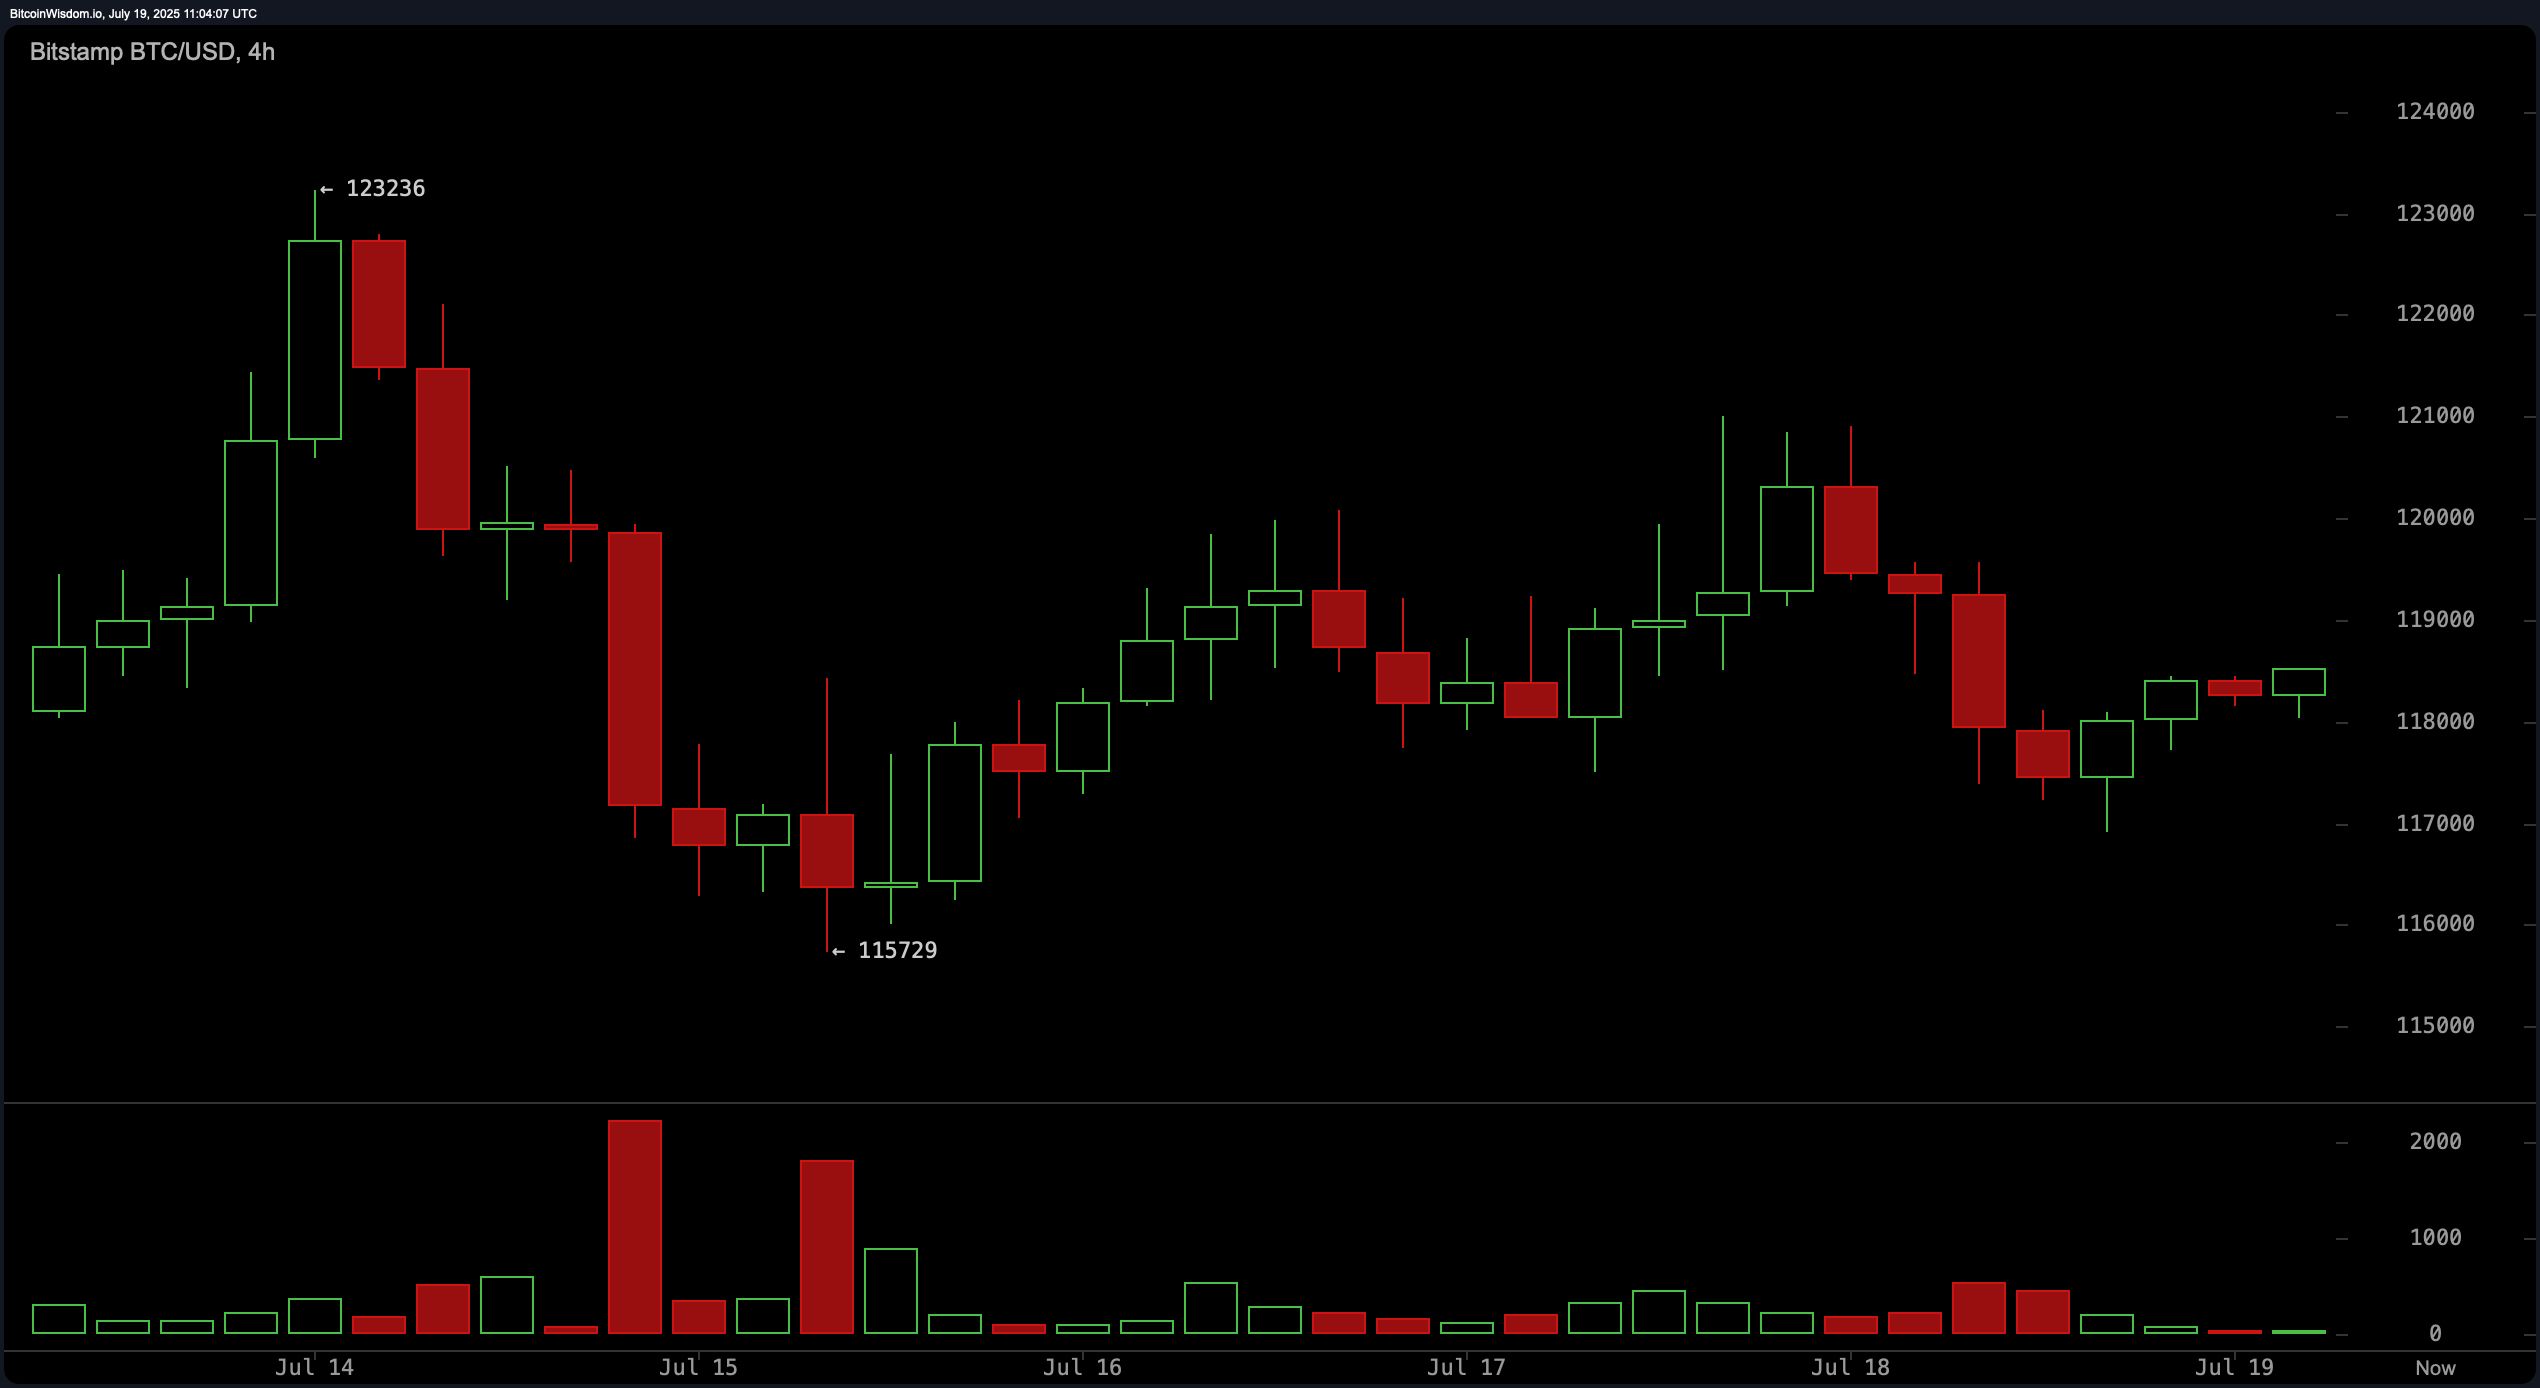
On the 4-hour chart, bitcoin retraced from the recent high of $123,236 and found support around $115,729, establishing a consolidation range between $116,000 and $120,000. While some buying activity emerged following the dip, momentum lacked follow-through, keeping the market in a neutral-to-bullish state. This chart indicates that strategic entries near the lower band of the channel may offer favorable risk-reward ratios, with target zones around $120,000 to $121,000 unless a significant breakout confirms a stronger bullish trend.
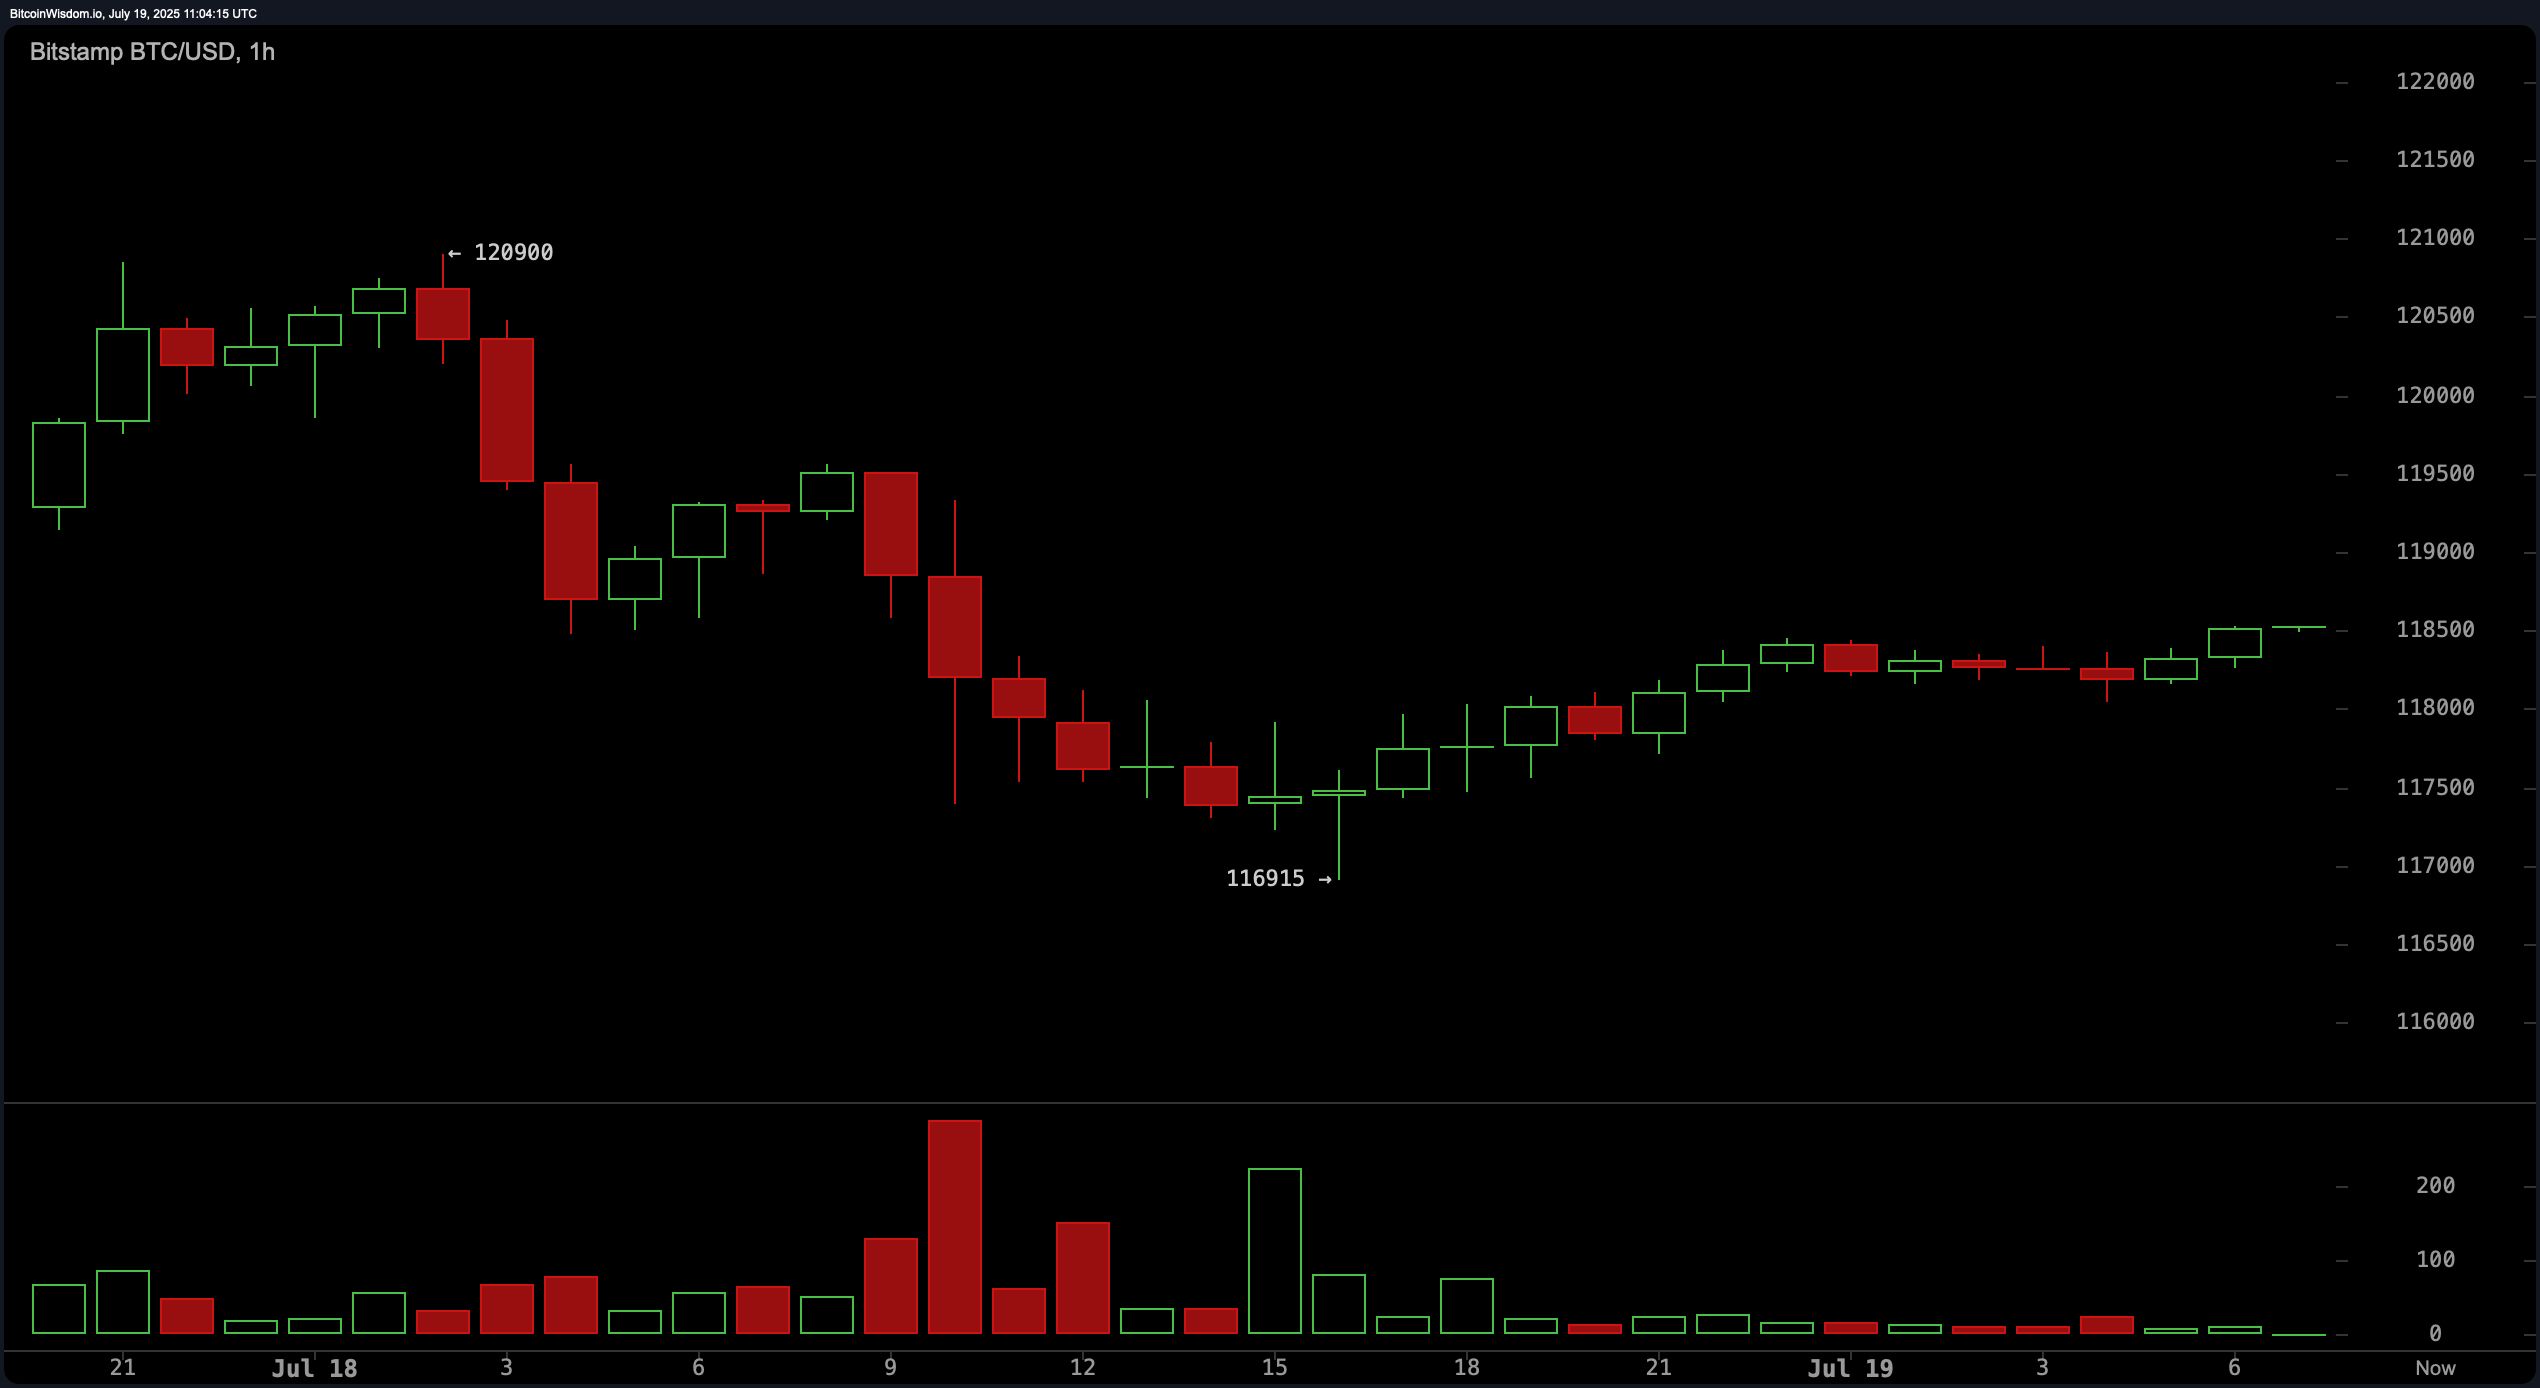
The 1-hour bitcoin chart revealed a short-term base near $116,915, from which bitcoin formed a minor upward structure marked by higher lows. However, the recovery lacked conviction, as demonstrated by weakening volume during the rebound. This indecision is evident as price action moved narrowly between $117,000 and $118,800. Traders employing short-term strategies may consider scalping within this zone, entering near the $117,000–$117,500 support and targeting exits around $118,800–$119,000, where resistance has historically appeared.
Oscillator readings indicate mixed market sentiment. The relative strength index (RSI) registered a value of 67, suggesting a market leaning toward overbought but still neutral. The Stochastic oscillator stood at 71 and the commodity channel index (CCI) at 68, both signaling neutrality. The average directional index (ADX) read 27, indicating a trend that lacks strong directional strength. The Awesome oscillator remained neutral at 8,565, while the momentum indicator showed a value of 7,224, signaling a bearish bias. Meanwhile, the moving average convergence divergence (MACD) posted a bullish signal at 3,301, reflecting moderate bullish divergence.
A comprehensive look at moving averages (MAs) reinforces the underlying bullish trend across timeframes. All major averages, including the 10-, 20-, 30-, 50-, 100-, and 200-period exponential moving averages (EMAs) and simple moving averages (SMAs), support a positive bias. The 10-period EMA stood at $117,148 and the 10-period SMA at $118,238, both closely aligned with the current price. The longer-term 200-period EMA and SMA came in at $97,953 and $97,742, respectively, showcasing bitcoin’s sustained strength well above key support levels.
Bull Verdict:
Despite short-term consolidation, the prevailing structure remains bullish. With all major moving averages aligned upward and support holding firmly above $115,000, the path of least resistance remains to the upside. A breakout above $120,000 with strong volume could set the stage for a retest of $123,000 and potentially new highs in the coming sessions.
Bear Verdict:
While the broader trend remains intact, bearish signals are emerging. Momentum is weakening, and key oscillators show indecision or divergence. If bitcoin fails to hold the $115,000 support zone, a sharper correction toward the $112,000–$110,000 area could unfold rapidly due to the lack of historical consolidation in that range.
Disclaimer: The content of this article solely reflects the author's opinion and does not represent the platform in any capacity. This article is not intended to serve as a reference for making investment decisions.
You may also like
Bitcoin’s Realized Cap Reaches $1 Trillion Milestone
Strategy Surpasses $71B in Bitcoin Holdings, Ranks 9th S&P 500

US-EU Trade Tension Sparks Crypto Market Volatility

Crypto Market Update: ETH, SOL, and XRP Show Diverging Trends Amid Increased Volatility