- XRP holds $2.20 support ahead of April 30 as traders monitor tightening Bollinger Bands and fading ETF momentum.
- MACD indicator shows weakening bullish signals, raising concerns about XRP’s ability to sustain its recent gains.
- ProShares confirms no XRP spot ETF launch on April 30, cooling earlier speculation about immediate market catalysts.
XRP is currently trading near $2.28, slightly below its recent high of $2.35, and just above key technical support at the 50-day Exponential Moving Average (EMA) of $2.20. The token has faced renewed resistance near $2.50, capping upside momentum going into the final trading day of April.
This 50-day EMA has emerged as a key support zone for XRP, while the 20-day EMA, currently sitting at $2.17, has shown reliability during past pullbacks. Together, these levels could define whether XRP consolidates or breaks down in the near term.
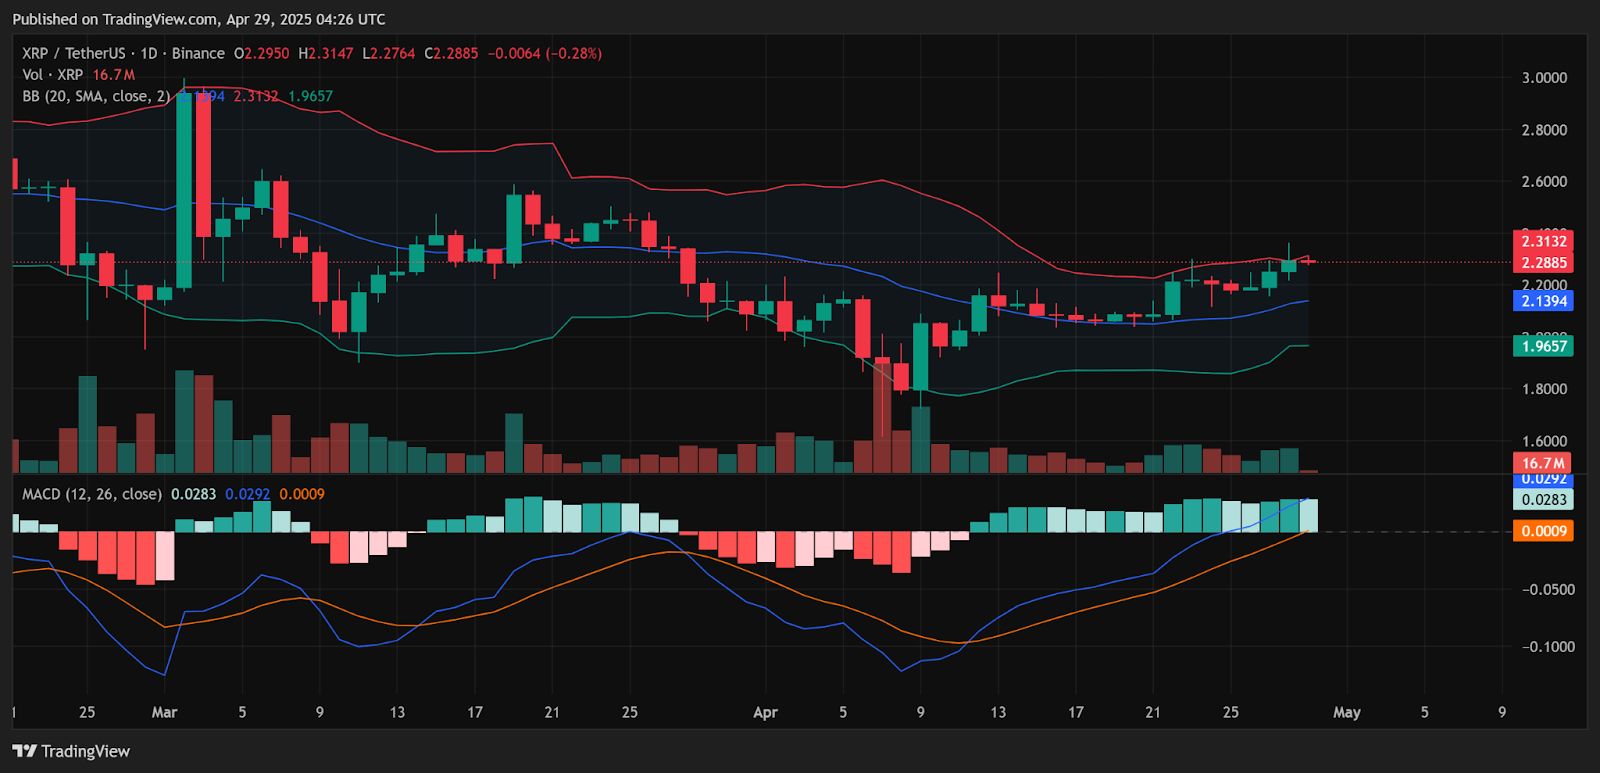
MACD Indicator Signals Weaker Momentum for XRP Price
On the daily chart, the Moving Average Convergence Divergence (MACD) shows the blue MACD line still above the orange signal line, which is typically bullish. However, the MACD histogram is shrinking—indicating that upward momentum is slowing.
If the MACD crosses below the signal line, it could mark the start of bearish momentum. This makes the $2.20 support level a key decision point for XRP’s short-term trend as April ends.
 Source: TradingView
Bollinger Bands Suggest XRP Could Enter Consolidation Phase
XRP is now trading near the upper Bollinger Band, which often indicates overbought conditions. If the price fails to stay above the middle band—defined by the 20-day Simple Moving Average (SMA)—XRP could slide toward the lower Bollinger Band. That would likely align with tests of the $2.20 and $2.17 EMAs.
Bollinger Bands tightening also suggests that a larger move may be coming—either a breakdown or breakout—depending on how XRP closes the month.
XRP to $8? Charting Guy’s Forecast Calls for Steady Climb, Not Hype
Chart analyst “Charting Guy” shared his XRP forecast on X (formerly Twitter), pointing to a gradual rally toward $8. His 4-hour chart shows price structures supported by multi-sigma deviation bands. Before hitting $8, he identified resistance at $3 and $4.20.
But he also warned against irrational expectations. A run from $0.28 to $8 represents a 2,750% gain—a massive cycle move by historical standards. He advised profit-taking along the way rather than waiting for unrealistic price targets that often trap retail traders.
XRP ETF Launch Not Happening on April 30, Say Analysts
Earlier reports claiming that a ProShares XRP ETF would launch on April 30 have been dismissed.
Bloomberg ETF analyst James Seyffart and a ProShares spokesperson clarified that no official launch is scheduled yet.
While a launch is still expected in the short to medium term, no official date has been set. The rumors stemmed from a regulatory filing from April 15, which was misinterpreted by some media outlets.
Related: Charts reveal high likelihood of altcoins to rally faster than expected in 2025
As confirmed by Nate Geraci of The ETF Store, the upcoming ProShares ETFs will not be spot-based . Instead, they will offer exposure to XRP via futures contracts, including leveraged and inverse options. That distinction matters for traders expecting direct market flows from an ETF listing.
Disclaimer: The information presented in this article is for informational and educational purposes only. The article does not constitute financial advice or advice of any kind. Coin Edition is not responsible for any losses incurred as a result of the utilization of content, products, or services mentioned. Readers are advised to exercise caution before taking any action related to the company.