GALA and SAND to Continue Rebound? Key Harmonic Pattern Signaling a Upside Move

Date: Wed, April 23, 2025 | 09:16 AM GMT
The cryptocurrency market has been under intense selling pressure recently, with Ethereum (ETH) posting its worst Q1 since 2018, sliding more than 45%. That bearish wave swept across the altcoins — and the gaming tokens Gala (GALA) and The Sandbox (SAND) weren’t spared either.
But there’s a shift in momentum brewing.
Both tokens have managed to stage an impressive rebound, each gaining over 20% this week and narrowing their year-to-date losses to under 50%. Interestingly, a classic harmonic pattern is now emerging, suggesting this recovery could continue.
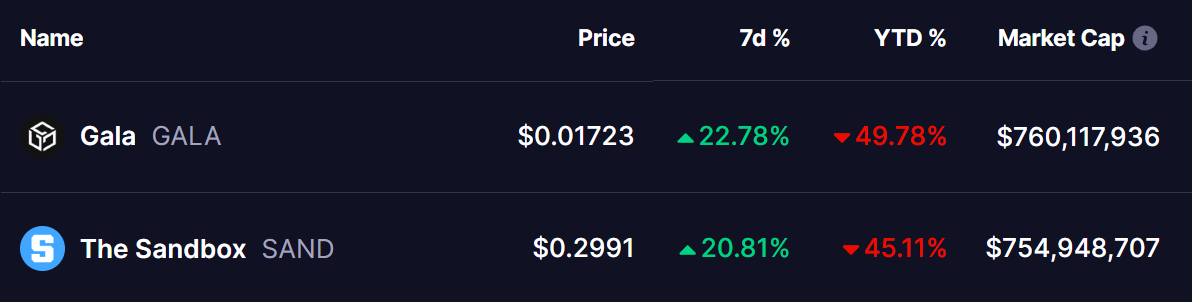 Source: Coinmarketcap
Gala (GALA) Analysis
On the daily Heikin Ashi chart, GALA is tracing a Bearish Cypher pattern — a well-known harmonic structure that typically precedes a bullish move toward the D point before any potential reversal.
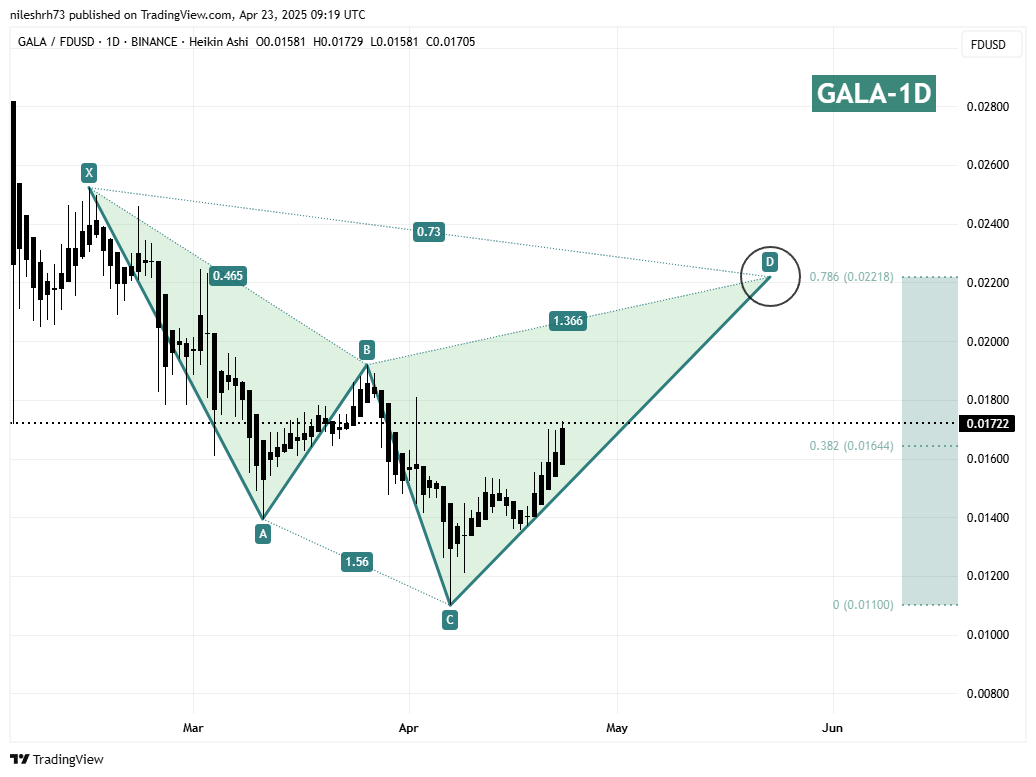 Gala (GALA) Daily Chart/Coinsprobe (Source: Tradingview)
The pattern kicked off from point X near $0.02523 on February 14, dropped sharply to point A, bounced to B, and then slid again to point C, which bottomed around $0.011 on April 7. Since then, the CD leg has been forming with solid upward momentum.
If the structure completes, point D is expected near $0.02218, the 78.6% Fibonacci retracement of the XC leg. That gives GALA a potential upside of around 28% from current levels near $0.01729.
The Sandbox (SAND) Analysis
SAND is showing a nearly identical Bearish Cypher structure. From a peak around $0.41 on February 14 (point X), SAND moved down to point A, then retraced to B, and dropped to C, bottoming near $0.2132 in early April.
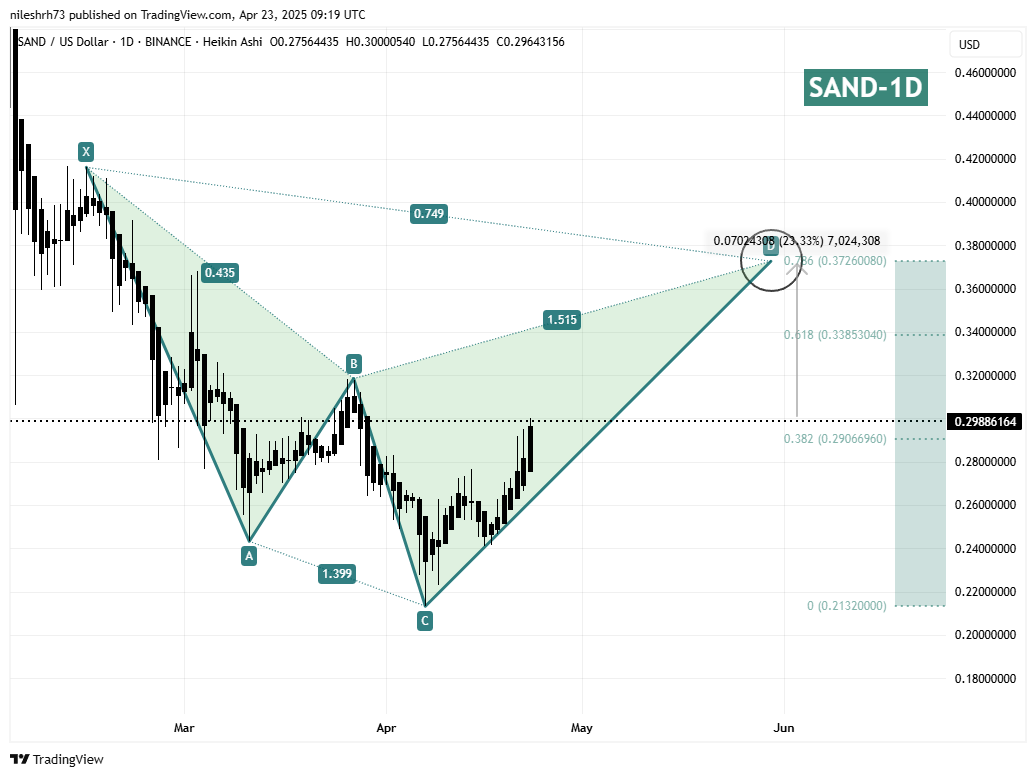 The Sandbox (SAND) Daily Chart/Coinsprobe (Source: Tradingview)
With the CD leg now in progress, price action suggests a bullish continuation. The D point aligns with the 78.6% Fibonacci level of the XC leg at $0.3760, pointing to a potential 23% upside from current levels around $0.30.
Key resistance lies at the 61.8% retracement near $0.3385 — a level bulls must clear to keep the momentum alive.
What’s Ahead?
While both GALA and SAND remain far below their all-time highs, the presence of these harmonic Cypher patterns offers a potential roadmap for further gains in the short term. As long as current trends hold and momentum stays positive, a continued rebound seems plausible.
However, traders should watch the D completion zones closely. Harmonic patterns often signal a potential reversal after the final leg is completed, so these price targets could also become areas of increased selling pressure.
Disclaimer: This article is for informational purposes only and not financial advice. Always conduct your own research before investing in cryptocurrencies.
Disclaimer: The content of this article solely reflects the author's opinion and does not represent the platform in any capacity. This article is not intended to serve as a reference for making investment decisions.
You may also like
Digital Commodity Capital Adds XRP to Its Portfolio, Bolstering Institutional Interest
BlockDAG Drops Price Pre-Reveal as Fartcoin Gains Traction

XRP Price Target Debated; SHIB Burns and Unstaked Gains

TRON Surpasses Resistance, Unstaked Promises High ROI