Kaspa (KAS) To Continue Rebound? Key Harmonic Pattern Signaling an Upside Move

Date: Mon, April 21, 2025 | 04:44 PM GMT
The cryptocurrency market has been under intense selling pressure recently, with Ethereum (ETH) posting its worst Q1 since 2018, sliding more than 45%. That bearish wave swept across the altcoin sector — and the Kaspa (KAS) token wasn’t spared either.
But there’s a shift in momentum brewing. KAS has managed to stage a rebound with a noticeable 8% weekly gain, narrowing its year-to-date drop to 27%. And interestingly, a classic harmonic pattern now hints that this recovery could continue further.
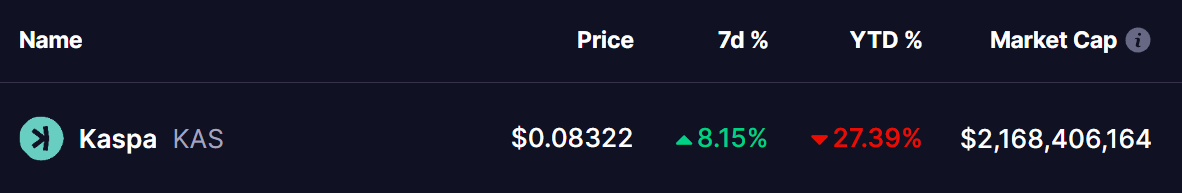 Source: Coinmarketcap
Harmonic Pattern Signals More Upside Move
The daily chart for KAS shows the formation of a Bearish Gartley pattern — a structure that typically signals a strong bullish move toward completion before any major reversal risk.
Kaspa’s sharp decline started around February 16 after it failed to hold above the $0.1142 resistance level (marked as point X). Since then, KAS shed nearly 54% of its value, bottoming out near $0.0555 on April 7 (point C).
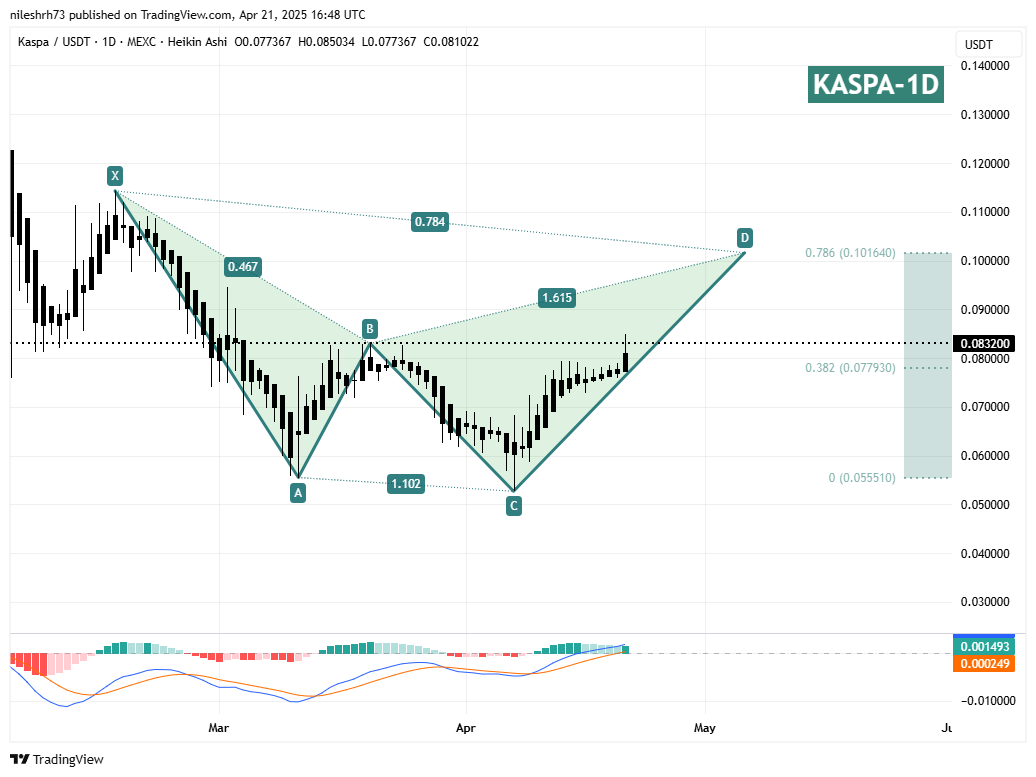 Kaspa (KAS) Daily Chart/Coinsprobe (Source: Tradingview)
However, after hitting that low, momentum has clearly shifted. KAS is now working through the CD leg of the pattern, moving higher with growing strength.
Based on the harmonic setup, the rebound could extend toward the final target (point D) near $0.1016 — roughly a 21% upside from the current price around $0.0832, if the pattern plays out as expected.
What’s Next for KAS?
If bullish momentum holds, KAS could climb toward the $0.1016 zone in the coming days. This area doesn’t just complete the Gartley pattern — it also lines up with the 78.6% Fibonacci retracement of the X-A move, making it a major resistance zone to watch closely.
However, caution is advised as KAS approaches this level. In harmonic trading, a reversal or profit-taking often occurs after the D point is reached.
On the downside, the $0.0779 area (38.2% Fibonacci retracement) is acting as a minor support. As long as KAS holds above this zone, the short-term bullish outlook remains intact.
Disclaimer: This article is for informational purposes only and not financial advice. Always conduct your own research before investing in cryptocurrencies.
Disclaimer: The content of this article solely reflects the author's opinion and does not represent the platform in any capacity. This article is not intended to serve as a reference for making investment decisions.
You may also like
Aptos Logs 133K Wallets, 558K Transactions in Osaka Expo Week One—Is Adoption
Aptos’ debut as the digital wallet provider at Expo 2025 Osaka showcases how seamless blockchain integration and soulbound NFTs can drive mainstream adoption, adding 133,000 new users in just one week.

$TRUMP Holders Dinner: Token Rockets 64% as Top Investors Chase Rare Trump Invite

DogWifHat ($WIF) Rallies 25% as Meme Coin Market Rebounds to $53.95 Billion
DogWifHat ($WIF) spearheads a meme coin market rebound with a 25% jump, riding a wave of renewed trading enthusiasm after a harsh downturn earlier in 2025.