Crypto Market Slips Again: Pi Coin Takes a Heavy Hit
- Pi Coin dropped nearly 19.53% in the last 24 hours, falling from $0.747 to $0.6011.
- Pi Coin has gained 8.71% this week but has lost over 57% in the past month, reflecting a bearish trend.
The global crypto market began its third trading day of the week in the red, shedding 2.26% and bringing the total market capitalization down to $2.64 trillion. Investor sentiment remains cautious, with the Fear and Greed Index still signaling fear across the market.
One of the biggest losers of the day is Pi Network’s native crypto PI Coin, which saw a steep decline of nearly 19.53% in just 24 hours. The price fell from $0.747 to an intraday low of $0.6011, with its current price hovering around $0.6190. This marks a sharp turn from its recent attempt to reach the $1 mark, where $0.70 was considered a crucial support level. That support has now flipped into resistance. Over the past month, Pi Coin has dropped more than 57% with a market cap of $4.25 billion.
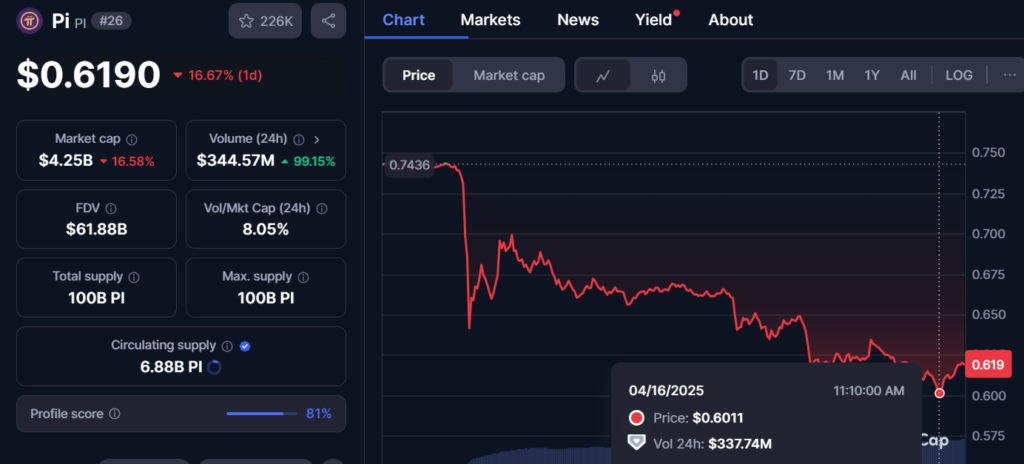 Pi Coin Price Chart (Source: CoinMarketCap
)
Pi Coin Price Chart (Source: CoinMarketCap
)
Interestingly, despite the recent drop, Pi Coin is still up 8.71% over the past week—largely due to its earlier rally, which was sparked by Pi Network’s integration with Chainlink. Chainlink recently included Pi in 22 new data feeds, making live pricing available for use in dApps and smart contracts. This development was announced on Pi Network’s official X (formerly Twitter) account.
Further, the daily trading volume of Pi Coin has surged by over 99.15%, hitting $344.57 million. This shows that market interest remains high, though buyers aren’t ready to pay more—leading to price pressure .
Pi Coin Price Analysis: Bearish Trend Deepens with Ongoing Price Drop
In the 4 hours PI/USDT chart, the crypto asset traded sideways for a while, with little movement. After this period of stability, the price took another dip within the next 4-hour session. This brief phase of flat movement led to another drop in price.
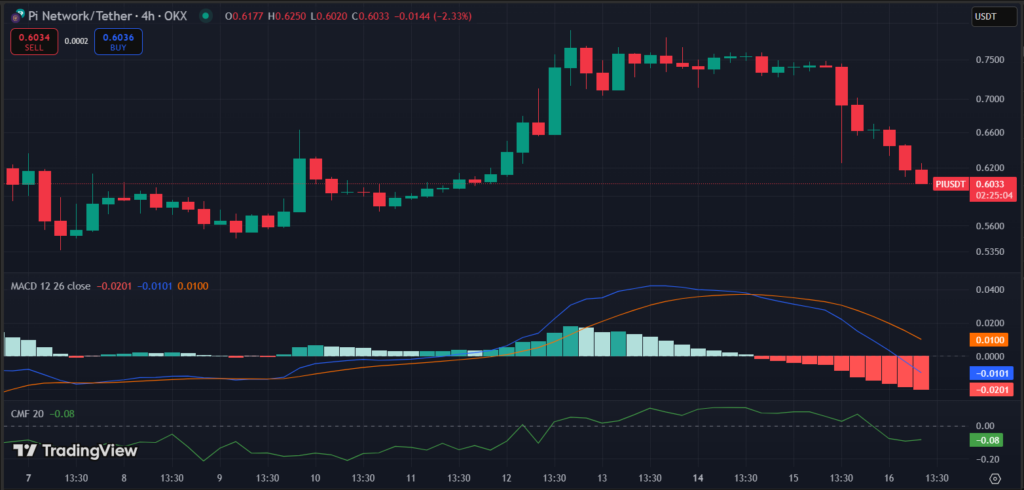 4-Hours Price Chart (Source: TradingView
)
4-Hours Price Chart (Source: TradingView
)
The RSI currently stands at 31.32, approaching oversold territory, which could signal a potential bounce or temporary relief. Meanwhile, The MACD has crossed below the signal line, indicating bearish momentum. The Chaikin Money Flow (CMF) stands at -0.08, indicating that selling pressure is still higher than buying pressure.
On the 1-day chart, Pi Coin is moving within a descending channel , which shows a clear downward trend. The MACD line is slightly above the signal line, which shows weak bullish momentum, but it’s not strong enough to reverse the overall bearish trend. The Chaikin Money Flow (CMF) on this chart is -0.18, indicating significant selling pressure.
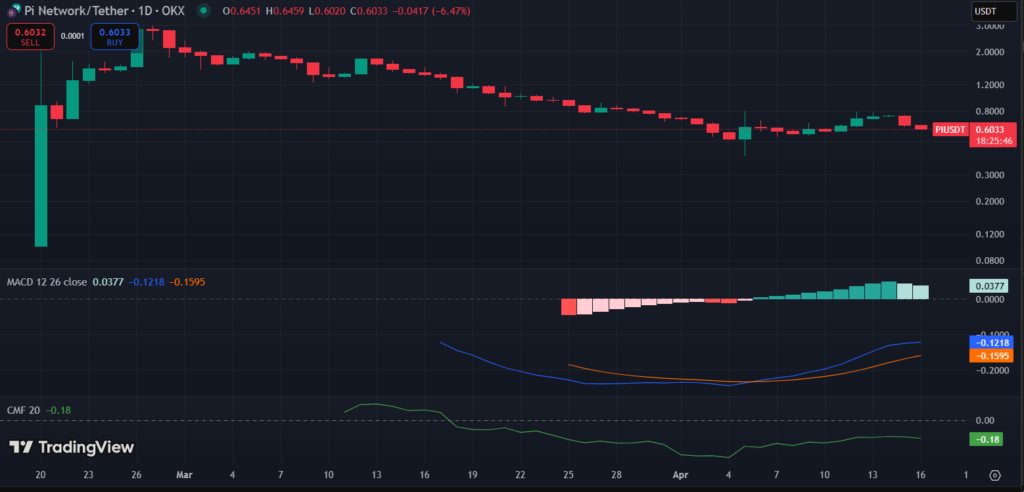 1-Day Price Chart (Source: TradingView
)
1-Day Price Chart (Source: TradingView
)
The overall outlook indicates a bearish trend. The immediate support level is around $0.587, which has previously seen buyers step in. If this support level breaks, the price could drop further, potentially testing $0.5588.
For resistance, Pi Coin faces challenges at $0.650 and around $0.712. If the price manages to break above $0.650, it could push toward the $0.740–$0.750 range.
Highlighted Crypto News Today:
29% Jump for MANTRA, What Is Fueling the Rally?
Disclaimer: The content of this article solely reflects the author's opinion and does not represent the platform in any capacity. This article is not intended to serve as a reference for making investment decisions.
You may also like
Gensler Warned of Crypto Crash Week Before Paul Atkins Sworn In as SEC Chair
The majority of crypto tokens out there are likely heading for collapse, arguing that they hold “no intrinsic value.”
3 Altcoins With Bullish Patterns Set to Trigger Explosive Moves

SEC will not refile $1 billion fraud case against Richard Heart

PUMP fell 41% in 24 hours