Uniswap (UNI) Testing Key Support – Could This Pattern Spark a Reversal?

Date: Thu, April 17, 2025 | 06:46 AM GMT
The cryptocurrency market has experienced a historically bearish first quarter, with Ethereum (ETH) suffering its worst decline since 2018, dropping a staggering 45%. This widespread downturn has significantly impacted altcoins , including Uniswap (UNI), which has shed more than 60% of its value this year.
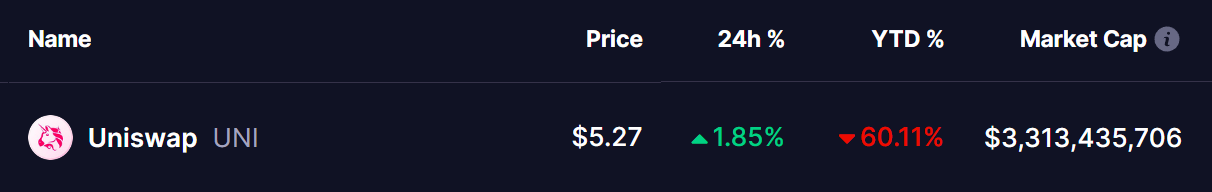 Source: Coinmarketcap
The token is now testing a key support zone where a potential rebound could take shape.
Could This Pattern Spark a Reversal?
On the weekly chart, UNI is currently testing right at a neckline support area between $4.55 and $5.50, a level that previously acted as a springboard for major rallies. What’s interesting is that the chart is showing signs of a possible head and shoulders pattern, a classic bearish setup — but as of now, UNI still has a real chance to flip things around by forming a proper right shoulder.
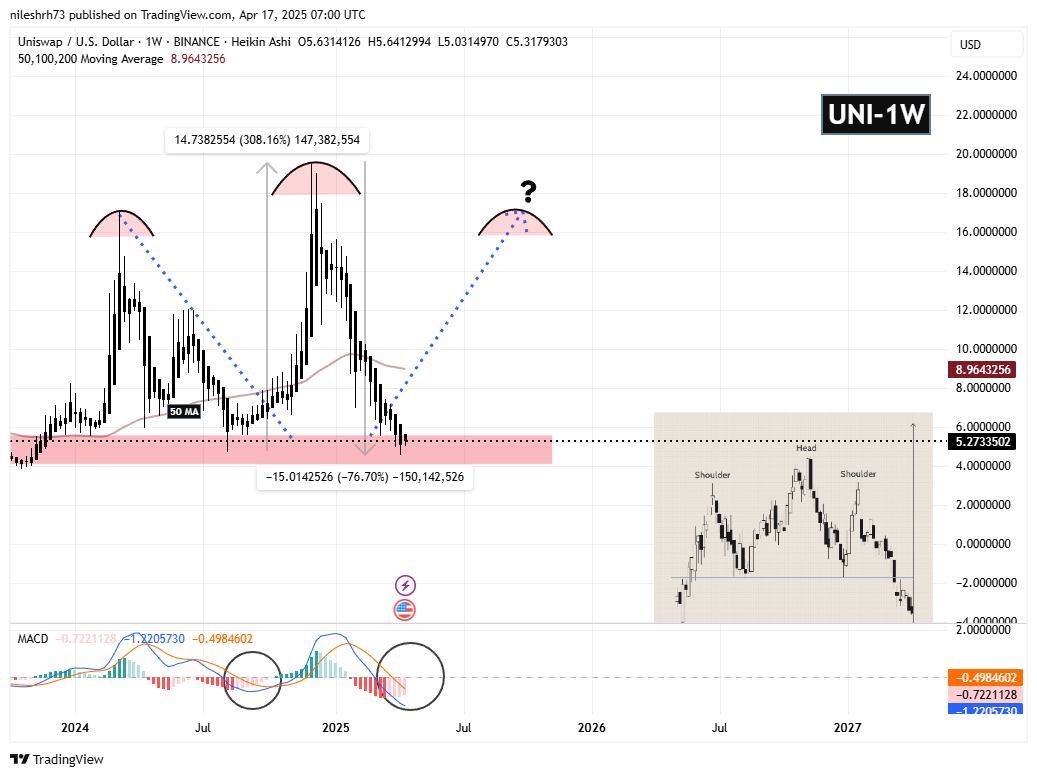 Uniswap (UNI) Weekly Chart/Coinsprobe (Source: Tradingview)
This potential pattern started forming after UNI faced heavy rejection from its March 2024 high around $17. After that peak, a sharp correction brought UNI back to the current support zone, marking the left shoulder. A strong rally of over 300% in late 2024 pushed the token back near its highs, forming the head. Then came another painful correction of around 76%, once again dragging it back down to the crucial neckline zone.
From here, if UNI truly follows the typical pattern behavior, we could see a strong bounce from this support level back up toward the $17 zone — a potential 220% upside from current prices. That bounce could complete the formation of the right shoulder before another decisive move — possibly a pullback toward the neckline for a true breakdown from the larger bearish pattern.
Adding more spice to the setup, the MACD is showing early signs of a potential bullish crossover. On the weekly timeframe, the MACD lines are starting to curl upwards — a setup similar to what happened during the last major rally. If this bullish crossover confirms in the coming weeks, it could provide the momentum UNI needs to fuel a strong rally toward the $17 zone.
What’s Ahead?
All eyes are now on how UNI behaves around this critical support zone. A strong bounce from here could set the stage for an epic rally, giving bulls a much-needed boost.
One key level to watch closely is the 50-week moving average (50 W MA) — a move above this could add strong confirmation that an upside rally is truly underway.
However, it’s important to keep in mind: if the neckline support at $4.55–$5.50 fails, UNI could risk breaking down sharply, confirming the full bearish head and shoulders pattern and potentially setting off another wave of selling.
Disclaimer: This article is for informational purposes only and not financial advice. Always conduct your own research before investing in cryptocurrencies.
Disclaimer: The content of this article solely reflects the author's opinion and does not represent the platform in any capacity. This article is not intended to serve as a reference for making investment decisions.
You may also like
Bitcoin ETFs Experience Influx Amid Positive Sentiment Shift in Crypto Market


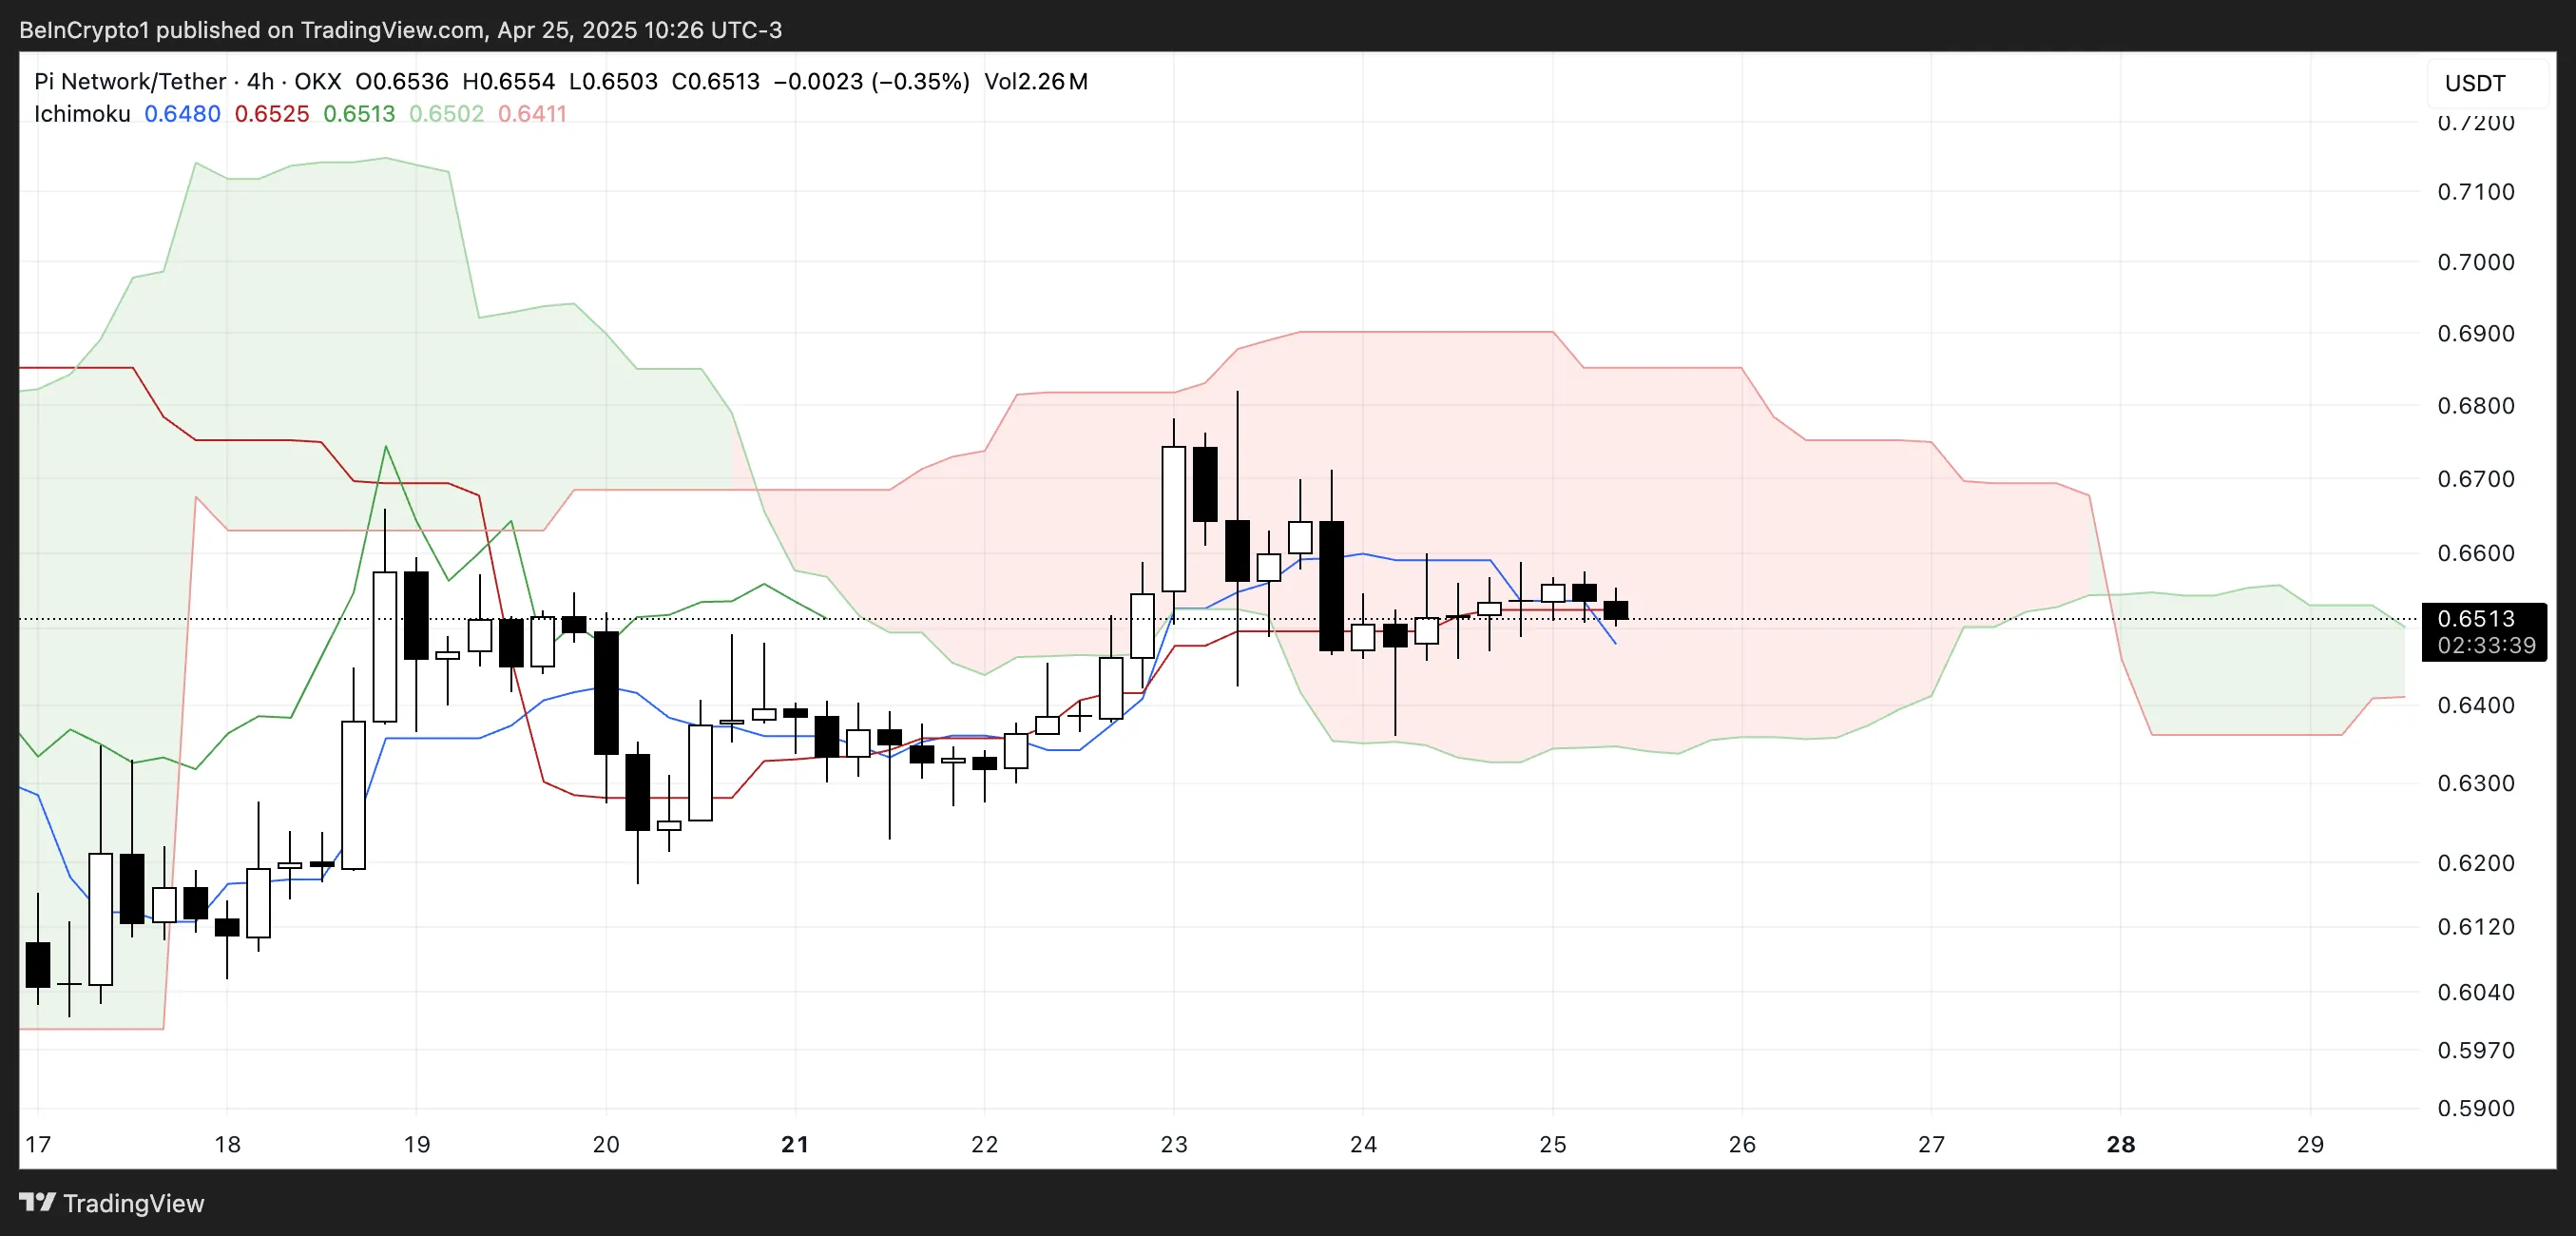
Pi Network Price Consolidation Holds Key to Possible Breakout Above $0.68
ARK Invest’s Bitcoin Forecast: Exploring Potential Paths to $2.4 Million Amid Adoption Concerns