Is Optimism (OP) Gearing Up for a Bullish Reversal? This Fractal Says Yes!

Date: Tue, April 15, 2025 | 08:30 AM GMT
The cryptocurrency market has faced a sharp correction phase, where Ethereum (ETH) itself recorded its worst Q1 decline since 2018 — plummeting by a staggering 50% this year. This widespread weakness has weighed heavily on altcoins , triggering sharp drops and investor concerns across the board.
Among the hardest-hit altcoins, Optimism (OP) has shed 62% of its value in 2025. But the tide may be turning. Recent activity has injected some cautious optimism back into the markets, with OP bouncing 10% in the last 7 days — and now, the chart is starting to paint a familiar and potentially bullish picture.
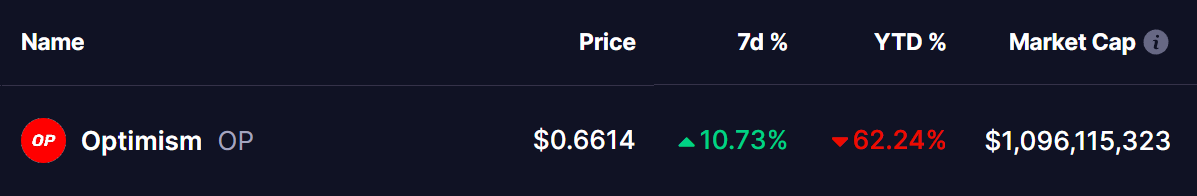 Source: Coinmarketcap
Optimism (OP) Chart Mirrors LINK’s 2024 Setup
Zooming out on the weekly timeframe, OP appears to be tracing a fractal pattern similar to Chainlink (LINK) before its explosive rally in late 2024.
Back then, LINK had been in a prolonged downtrend, forming a classic head-and-shoulders top, followed by a multi-month bottoming phase. Crucially, LINK found strong support in the gray demand zone near $8.50, reclaimed its 50-week moving average, and printed a bullish MACD crossover — a combination that lit the fuse for a +200% move straight toward $30.
Optimism now finds itself in a strikingly similar position. The price has dropped into its own gray demand zone near $0.60, and just like LINK, the MACD is now showing a bullish crossover below the zero line — often viewed as a strong reversal signal. Price action is coiling just beneath the 25-week moving average, which currently hovers around $1.46. A clean move above this level could be the catalyst OP needs to break out and ignite a broader uptrend.
This strong visual similarity between the two charts, paired with positive momentum signals, adds weight to the bullish case.
What’s Next for Optimism (OP)?
No chart pattern is a crystal ball — but crypto markets are notorious for repeating historical fractals, especially when sentiment flips.
If OP follows LINK’s 2024 path, a confirmed breakout above the $1.46 level could open the floodgates for a sustained rally. In that scenario, OP could eye targets of $6.0, $6.50, and beyond in the coming months — especially if macro conditions and ETH itself begin to recover.
However, it’s worth remembering: this setup could fail. A loss of support at the current demand zone could invalidate the pattern and drag prices lower. Traders should watch for confirmation before making high-conviction moves.
Disclaimer: This article is for informational purposes only and not financial advice. Always conduct your own research before investing in cryptocurrencies.
Disclaimer: The content of this article solely reflects the author's opinion and does not represent the platform in any capacity. This article is not intended to serve as a reference for making investment decisions.
You may also like
WCT briefly broke through $0.65
New spot margin trading pair — VTHO/USDT!
BNB Completes 31st Quarterly Token Burn, Worth Approximately $916 Million
Mantra CEO proposes burning $236M in tokens to rebuild trust