- HYPE is projected to reach up to $32.80 by Q4 2025 under bullish momentum and macro crypto tailwinds.
- The strongest breakout potential is anticipated in Q3 and Q4 if the 200-EMA flips to support.
- RSI and MACD confirm growing momentum in Q2, possibly leading to price discovery toward the $20.90–$25.50 range.
Hyperliquid (HYPE) is a decentralized exchange (DEX) focused on perpetual futures trading. Built on its own custom Layer-1 blockchain, the platform aims to deliver the speed and reliability of centralized exchanges while maintaining on-chain transparency and control.
Table of contents
- Key Features of Hyperliquid:
- Recent Developments:
- Community and Governance:
- Security Measures:
- Hyperliquid (HYPE) Price Prediction 2025-2030 Overview
- Bollinger Band Analysis for Hyperliquid (HYPE)
- MACD Analysis for Hyperliquid (HYPE)
- Relative Strength Index (RSI) Analysis for Hyperliquid (HYPE)
- Support and resistance levels for Hyperliquid (HYPE)
- Hyperliquid (HYPE) 2025 Price Prediction Analysis
- Quarter 1 (Jan–Mar 2025)
- Quarter 2 (Apr–Jun 2025)
- Quarter 3 (Jul–Sep 2025)
- Quarter 4 (Oct–Dec 2025)
- Summary Table: Hyperliquid (HYPE) Quarterly Price Forecast for 2025
- Hyperliquid (HYPE) Price Prediction for 2026
- Hyperliquid (HYPE) Price Prediction for 2027
- Hyperliquid (HYPE) Price Prediction for 2028
- Hyperliquid (HYPE) Price Prediction for 2029
- Hyperliquid (HYPE) Price Prediction for 2030
- FAQs
Key Features of Hyperliquid:
- Custom Layer-1 Blockchain: Hyperliquid runs on a proprietary Layer-1 chain powered by the HyperBFT consensus mechanism. This infrastructure supports ultra-fast transaction finality and handles up to 100,000 orders per second.
- On-Chain Perpetual Futures: The platform supports fully on-chain order books for perpetual contracts, offering leverage up to 50x. This makes it a powerful tool for advanced traders looking for decentralized leverage trading.
- HYPE Token Utility: The native token, HYPE, powers the ecosystem. It is used for governance participation, staking incentives, and paying transaction fees within the platform.
Recent Developments:
- Token Buyback: Hyperliquid recently initiated a $3 million HYPE token buyback, signaling confidence in the protocol’s future and providing strong market support.
- Market Performance: As of April 10, 2025, HYPE is trading near $13.77, with a 24-hour trading volume of approximately $237.58 million. The total circulating supply is around 333.93 million tokens, placing its market cap at $4.51 billion.
Community and Governance:
Hyperliquid emphasizes user ownership by allocating 70% of its token supply to community distribution. Revenue generated by the protocol is redistributed to users, while the Hyper Foundation oversees long-term development and protocol governance.
Security Measures:
The platform integrates native multi-signature transaction support. This enhances user security by requiring multiple approvals for certain operations, aligning with industry best practices for fund protection.
Hyperliquid (HYPE) Price Prediction 2025-2030 Overview
| Year | Minimum Price (USD) | Average Price (USD) | Maximum Price (USD) |
| 2025 | 9.8 | 17.4 | 32.8 |
| 2026 | 15.3 | 28.6 | 51 |
| 2027 | 24.8 | 41.3 | 68.5 |
| 2028 | 34.2 | 55.1 | 82 |
| 2029 | 41.7 | 63.8 | 95.6 |
| 2030 | 47.5 | 74.2 | 112.3 |
Bollinger Band Analysis for Hyperliquid (HYPE)
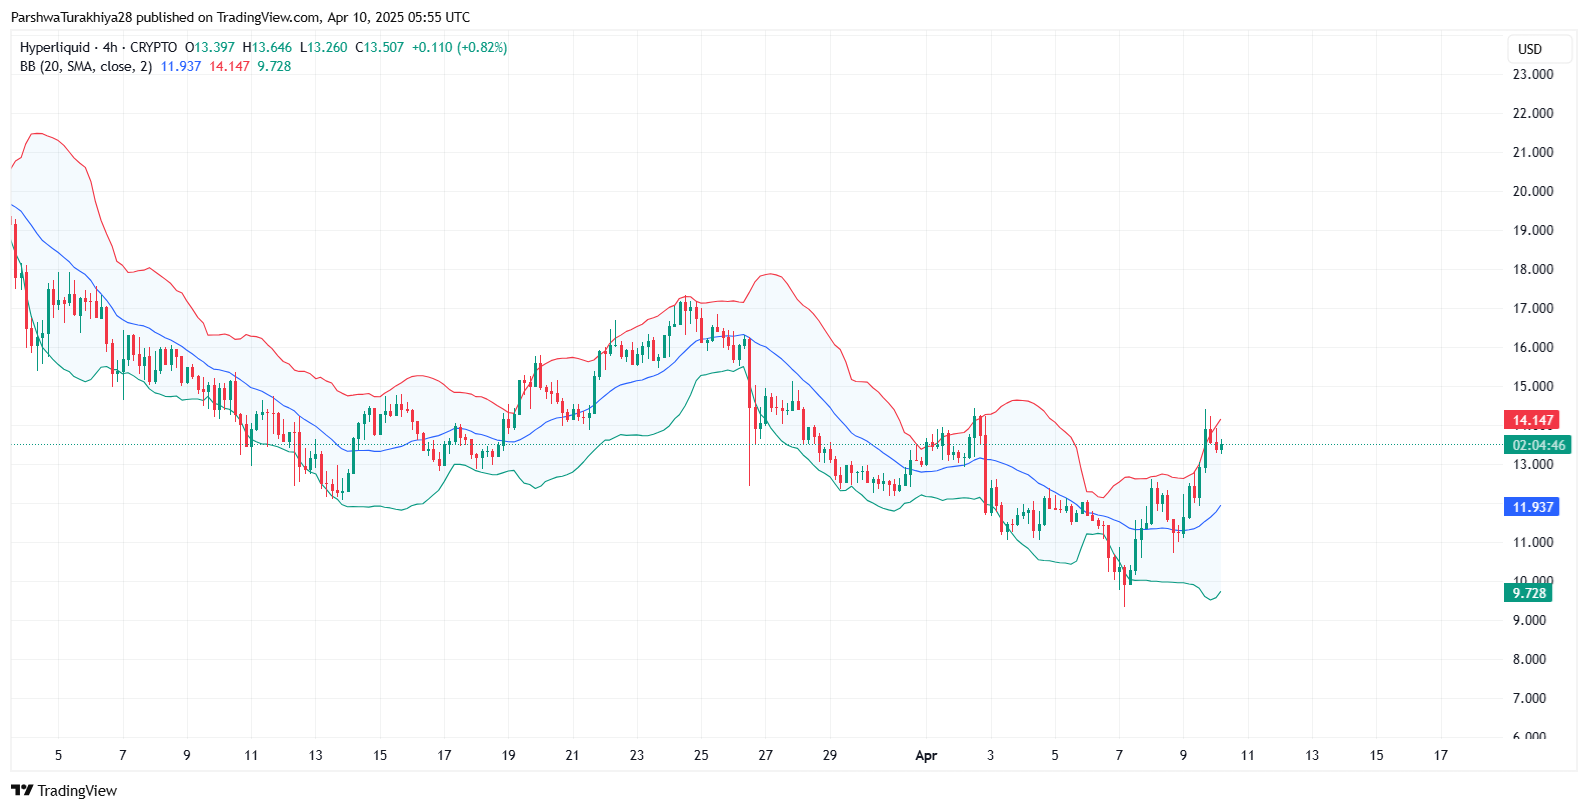 Hyperliquid (HYPE) price chart (Source: TradingView
)
Hyperliquid (HYPE) price chart (Source: TradingView
)
The Bollinger Bands applied to the 4-hour chart of HYPE show a sharp volatility expansion following a breakout from the lower consolidation zone around $10. The price recently surged and tested the upper band near $14.147, which typically signals temporary overbought conditions. The middle band (20-period SMA), now sitting around $11.937, acts as the mean reversion anchor.
The expansion of the bands confirms a high volatility environment, suggesting that the current rally may either continue if supported by strong volume or revert to test support near the midline. A close above the upper band with sustained momentum could signal further upward movement, while a failure to maintain current levels may lead to consolidation between $11.90 and $13.00 before the next move.
MACD Analysis for Hyperliquid (HYPE)
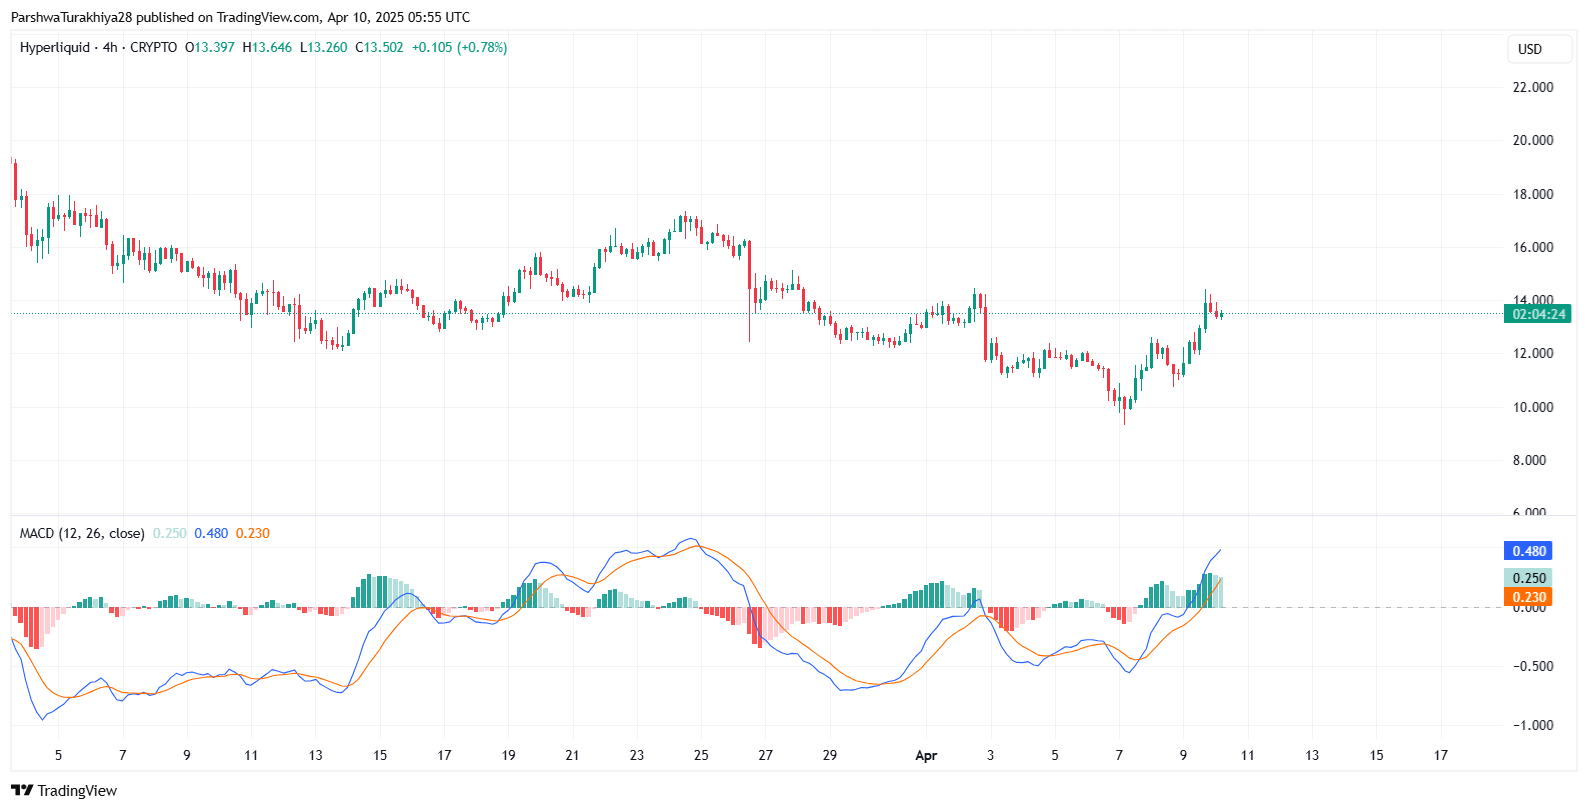 Hyperliquid (HYPE) price chart (Source: TradingView
)
Hyperliquid (HYPE) price chart (Source: TradingView
)
The MACD indicator presents a firm bullish crossover, with the MACD line at 0.480 and the signal line at 0.230. The histogram bars are green and increasing, pointing to strengthening bullish momentum. The crossover occurred just after a significant price bounce from the $10.20 zone, and its continuation signals increasing buyer dominance. Historically, MACD reversals following prolonged downtrends tend to confirm trend shifts or initiate mid-cycle rallies.
As of now, the MACD structure supports the thesis of a sustainable upward movement. However, any flattening or crossover of the MACD and signal lines in the coming sessions should be watched closely as it would imply momentum exhaustion and possible range trading.
Relative Strength Index (RSI) Analysis for Hyperliquid (HYPE)
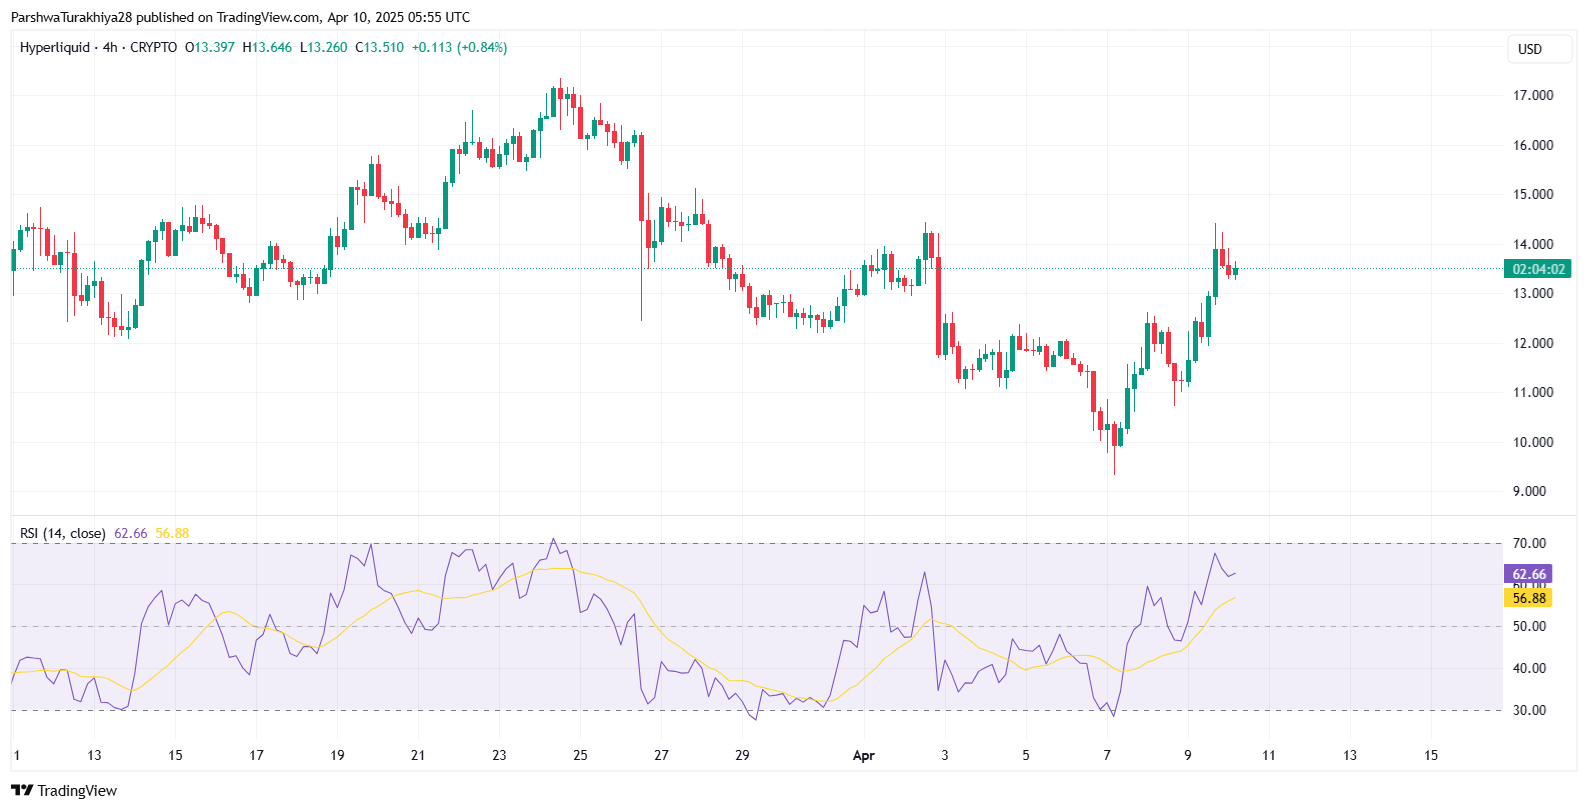 Hyperliquid (HYPE) price dynamics (Source: TradingView
)
Hyperliquid (HYPE) price dynamics (Source: TradingView
)
The Relative Strength Index (RSI) for HYPE on the 4-hour timeframe currently reads 62.66, having just pulled back slightly after nearing the 70-overbought threshold. This movement reflects a bullish phase that is beginning to cool off but not yet reversing. The RSI’s climb from sub-40 levels earlier in April to the current zone highlights strong momentum driven by recent buyer pressure.
The RSI moving average line sits at 56.88, reinforcing bullish bias as long as RSI remains above it. However, should the index fall below 55, it may suggest a deeper consolidation phase. If RSI manages to break into the 70–75 region again, it could confirm the next leg of bullish continuation toward upper resistance levels.
Support and resistance levels for Hyperliquid (HYPE)
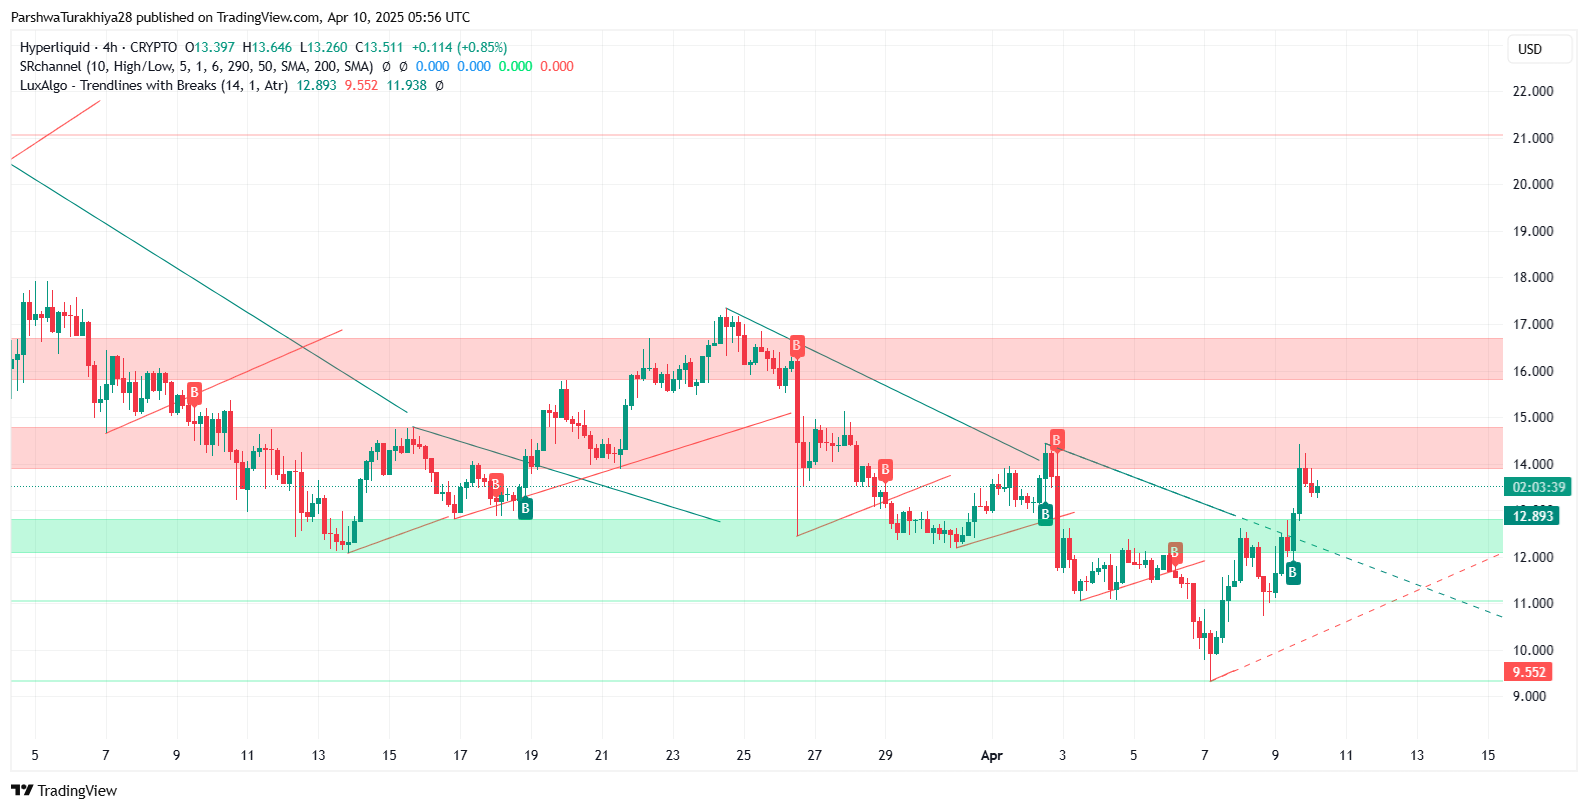 Hyperliquid (HYPE) price chart (Source: TradingView
)
Hyperliquid (HYPE) price chart (Source: TradingView
)
From a structural perspective, Hyperliquid faces its first major resistance between $13.80 and $14.80, highlighted by multiple rejections in recent weeks. This red zone aligns with both horizontal resistance and previous breakout failures, making it a crucial barrier for further upside. A breakout above this level, if confirmed with volume, could pave the way for a rally toward the next supply zone near $16.50–$17.80, and in more aggressive bullish cases, toward $21.00.
On the downside, the nearest support lies at $12.89, as marked by the green zone and reinforced by the latest breakout retest. Below that, secondary support zones sit at $11.20–$11.60, which align with the midline of the Bollinger Bands and short-term trendline support. If bearish pressure intensifies, stronger demand exists between $9.50 and $10.20, which previously served as a base for a rebound.
Hyperliquid (HYPE) 2025 Price Prediction Analysis
 Hyperliquid (HYPE) price analysis 2025 (Source: TradingView
)
Hyperliquid (HYPE) price analysis 2025 (Source: TradingView
)
Quarter 1 (Jan–Mar 2025)
Predicted Range:
- Minimum: $9.80
- Average: $12.40
- Maximum: $15.80
Analysis:
The first quarter was characterized by a prolonged correction phase, where price action steadily declined from early January levels around $19, bottoming out near $9.80 by mid-March. This movement aligned with the broader bearish trend across EMAs, especially the sustained resistance from the 100-EMA and 200-EMA. While early Q1 remained under pressure, March hinted at a structural shift as the price began consolidating near $10 and started forming higher lows. RSI hovered below 45 for most of the quarter, suggesting suppressed momentum. However, volume spikes and MACD’s near-bottom flattening indicated that Q1 likely marked the end of the correction cycle and built a base for Q2 recovery.
Quarter 2 (Apr–Jun 2025)
Predicted Range:
- Minimum: $11.50
- Average: $15.80
- Maximum: $20.90
Analysis:
April has opened with a notable breakout attempt. HYPE has broken above the 20-EMA and 50-EMA zones ($12.35–$12.83), with candles pushing toward the 100-EMA at $14.28. This quarter is expected to test the strength of the rebound. If the token can reclaim and sustain levels above the 200-EMA, we may see a continuation toward $18–$21. Bollinger Bands show volatility expansion, and the MACD has delivered a clean crossover with strengthening histogram bars. RSI is nearing 63, which suggests moderate bullish momentum without overbought conditions yet. Traders should watch for a clean flip of the 200-EMA from resistance to support, which would validate the upper target around $20.90. However, if the move fails, consolidation between $12.00 and $14.50 will likely dominate.
Quarter 3 (Jul–Sep 2025)
Predicted Range:
- Minimum: $14.80
- Average: $18.90
- Maximum: $25.50
Analysis:
Assuming Q2 ends with a confirmed breakout above the 200-EMA and stabilization above $15, Q3 could act as a breakout continuation phase. Price action may enter a steeper uptrend with support from institutional buyers, especially if Hyperliquid expands its integrations or sees growth in on-chain activity. RSI could trend in the 65–75 zone during rallies, while MACD may remain in bullish territory. The psychological zone near $20 may experience resistance, but momentum indicators and rising EMAs would likely support higher highs if volume expands. This quarter could also witness a brief consolidation between $17 and $19 before the next leg toward the projected high near $25.50.
Quarter 4 (Oct–Dec 2025)
Predicted Range:
- Minimum: $17.80
- Average: $21.40
- Maximum: $32.80
Analysis:
Q4 is expected to be the most volatile and potentially the most profitable for HYPE holders. If macro crypto sentiment is bullish and the protocol sees wider usage or listing expansion, a rally toward $30+ is plausible. Price action could test historical resistance zones near $28–$30, which may serve as inflection points. Indicators may flash short-term overbought signals (RSI >75, MACD peaks), leading to corrections. However, if momentum holds, price discovery beyond $30 is not off the table. Traders should expect high volatility and possible profit-taking zones. If the rally fails to sustain, a fallback to $21–$24 could present reaccumulation opportunities before any new rally in 2026.
Summary Table: Hyperliquid (HYPE) Quarterly Price Forecast for 2025
| Quarter | Minimum (USD) | Average (USD) | Maximum (USD) |
| Q1 (Jan–Mar) | 9.80 | 12.40 | 15.80 |
| Q2 (Apr–Jun) | 11.50 | 15.80 | 20.90 |
| Q3 (Jul–Sep) | 14.80 | 18.90 | 25.50 |
| Q4 (Oct–Dec) | 17.80 | 21.40 | 32.80 |
Hyperliquid (HYPE) Price Prediction for 2026
In 2026, Hyperliquid may enter a more established growth phase as DeFi adoption matures. With its projected average price of $28.6, the token could benefit from protocol upgrades and deeper liquidity. A sustained bullish cycle might test the $51 mark, while $15.3 remains a potential retracement zone during market corrections or high volatility.
Hyperliquid (HYPE) Price Prediction for 2027
The year could see Hyperliquid gaining broader institutional attention, potentially positioning itself as a key liquidity protocol in decentralized markets. With an average price target of $41.3 and a peak near $68.5, market participants may look for consolidation above $25 if fundamentals stay intact. Price expansion could be driven by increased user metrics and integrations.
Hyperliquid (HYPE) Price Prediction for 2028
If HYPE maintains its growth trajectory, 2028 might become a pivotal expansion year. The token could stabilize around $55.1, with long-term holders eyeing highs of $82 in a favorable macro environment. Corrections may revisit the $34 region, but strong on-chain utility would likely keep sentiment bullish throughout the year.
Hyperliquid (HYPE) Price Prediction for 2029
By 2029, Hyperliquid may transition into a multi-chain liquidity solution with cross-ecosystem interoperability. With an expected average price near $63.8, it may test $95.6 if protocol revenue and total value locked (TVL) continue trending upward. A dip toward $41.7 could offer a strategic accumulation opportunity during broader market pullbacks.
Hyperliquid (HYPE) Price Prediction for 2030
Hyperliquid could emerge as a matured DeFi staple by 2030, possibly serving both retail and institutional use cases. With price projections peaking at $112.3 and an average around $74.2, market structure may reflect long-term sustainability. Even if temporary corrections pull price to $47.5, the overall outlook remains highly bullish if adoption and innovation continue.
FAQs
HYPE is expected to range between $9.80 and $32.80 in 2025, with momentum building into the final quarter for a possible breakout.
The average projected price for HYPE in 2026 is around $28.60, reflecting broader DeFi growth and platform-level upgrades.
Yes, if bullish sentiment holds and Hyperliquid executes key roadmap milestones, the token could test highs near $51.
MACD crossover, RSI trending above 60, and breakout attempts above the 200-EMA support bullish continuation in current price action.
Key support lies between $11.20 and $12.90, while deeper corrections may revisit the $9.50–$10.20 base.
If the protocol continues growing in trading volume, on-chain activity, and utility, HYPE holds strong long-term potential.
Sustained adoption, multi-chain expansion, revenue growth, and institutional participation are potential catalysts for reaching $100+ by 2030.
RSI around 62–63 indicates bullish momentum with room for further upside, provided overbought territory isn’t hit prematurely.
HYPE is used for governance, staking rewards, and transaction fee payments on the Hyperliquid network.
Yes, provided Hyperliquid delivers consistent innovation and ecosystem value, a peak price near $112.30 remains within technical and fundamental reach.
Disclaimer: The information presented in this article is for informational and educational purposes only. The article does not constitute financial advice or advice of any kind. Coin Edition is not responsible for any losses incurred as a result of the utilization of content, products, or services mentioned. Readers are advised to exercise caution before taking any action related to the company.