XRP Bears Dominate as Bulls Defend A Key Support Level

XRP’s price dip shows bearish control, but a rebound in RSI and critical support tests suggest early signs of consolidation or recovery.
XRP has experienced a significant downturn in recent price action, with its value dropping nearly 15% over the past seven days as bears maintain control of the market. The coin’s technical indicators are showing mixed signals, with the RSI rebounding from oversold territory while Ichimoku Cloud patterns continue to paint a predominantly bearish picture.
Despite yesterday’s test of the critical $2.06 support level resulting in a temporary bounce, the momentum remains negative, with short-term EMAs positioned below long-term averages. The move from extreme oversold conditions suggests XRP might be entering a consolidation phase before its next significant price movement.
XRP RSI Is Up From Oversold Levels
XRP’s Relative Strength Index (RSI) is currently at 36.37, showing a notable rebound from a low of 27.49 just a few hours ago. This upward shift indicates a shift in momentum, as buying interest has started to pick up after a period of heavy selling pressure.
Although still in the lower range, this recovery suggests that traders may be stepping back in. That could mean they are potentially viewing the recent dip as an opportunity.
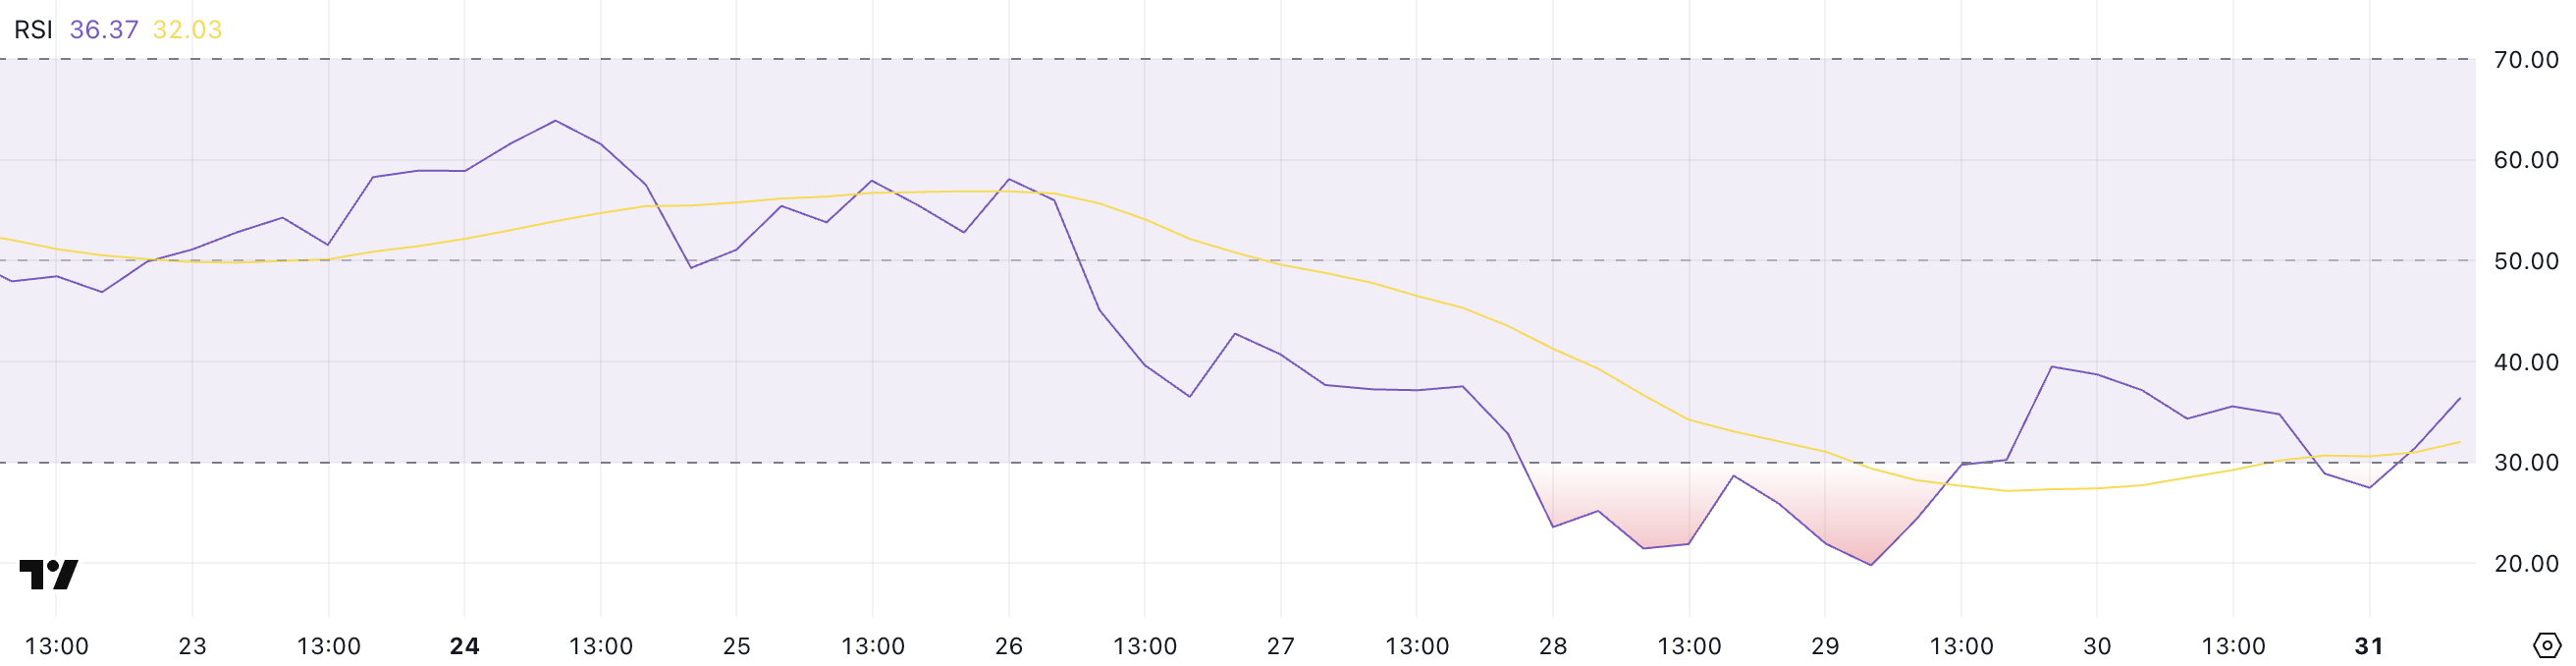 XRP RSI. Source:
TradingView.
XRP RSI. Source:
TradingView.
RSI is a widely used momentum indicator that measures the speed and change of price movements on a scale from 0 to 100. Readings below 30 typically indicate that an asset is oversold and may be undervalued, while readings above 70 suggest it is overbought and could be due for a correction.
XRP’s bounce from 27.49 to 36.37 signals that it may have just exited oversold conditions. This could mean that the recent selling phase is easing. If the buying momentum continues to build, XRP might be entering the early stages of a potential recovery.
XRP Ichimoku Cloud Shows A Bearish Scenario
XRP’s Ichimoku Cloud chart shows that the price action remains below both the red baseline (Kijun-sen) and the blue conversion line (Tenkan-sen). That indicates the prevailing momentum is still bearish.
The candles are also forming well beneath the cloud, which reflects a broader downtrend.
When the price is under all major Ichimoku components like this, it typically signals continued downward pressure unless a strong reversal breaks those resistance levels.
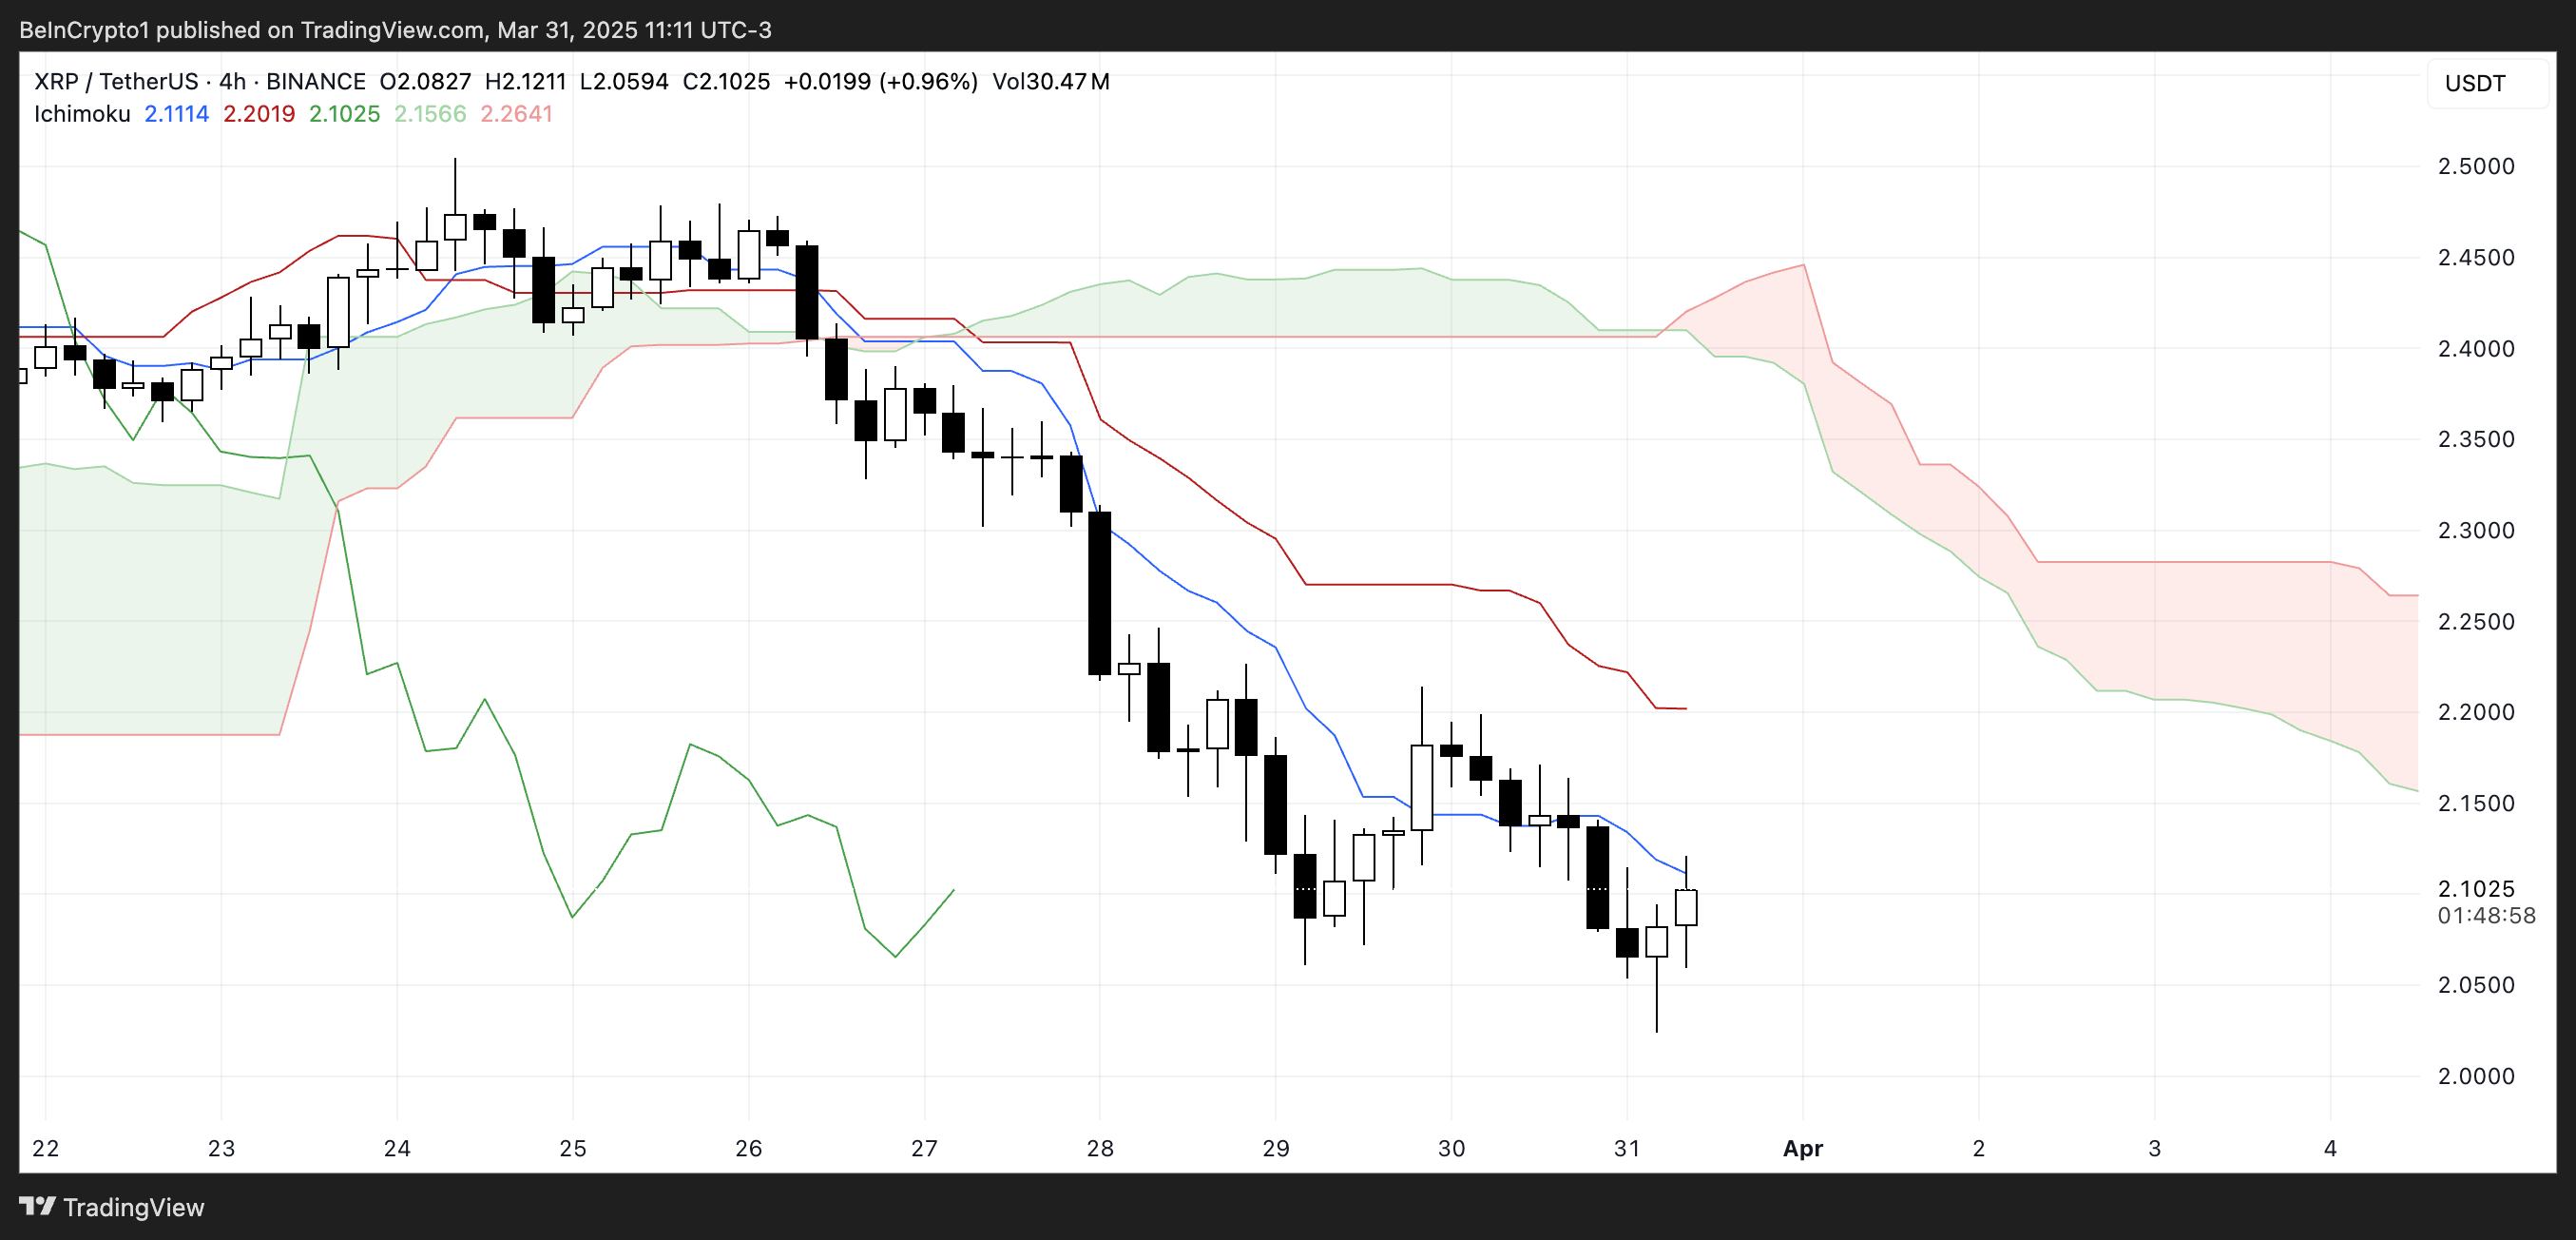 XRP Ichimoku Cloud. Source:
TradingView.
XRP Ichimoku Cloud. Source:
TradingView.
Additionally, the cloud ahead is red and spans horizontally with a downward slope, reinforcing the bearish outlook in the near term. The thickness of the cloud suggests moderate resistance if the price attempts to move upward.
However, some consolidation is evident in the recent candles, showing that sellers may be losing some control.
For any potential trend reversal, XRP would need to break above the Tenkan-sen and Kijun-sen, and eventually challenge the cloud itself — a move that would require a clear uptick in momentum.
XRP Could Rise After Testing An Important Support Yesterday
XRP’s EMA lines are clearly aligned in a bearish formation, with the short-term averages sitting well below the long-term ones and a noticeable gap between them—highlighting strong downward momentum.
Yesterday, XRP price tested the support level at $2.06 and rebounded, showing that buyers are still active at that zone. However, this support remains critical. If it is tested again and fails to hold, XRP could fall further. Its next major support sitting around $1.90.
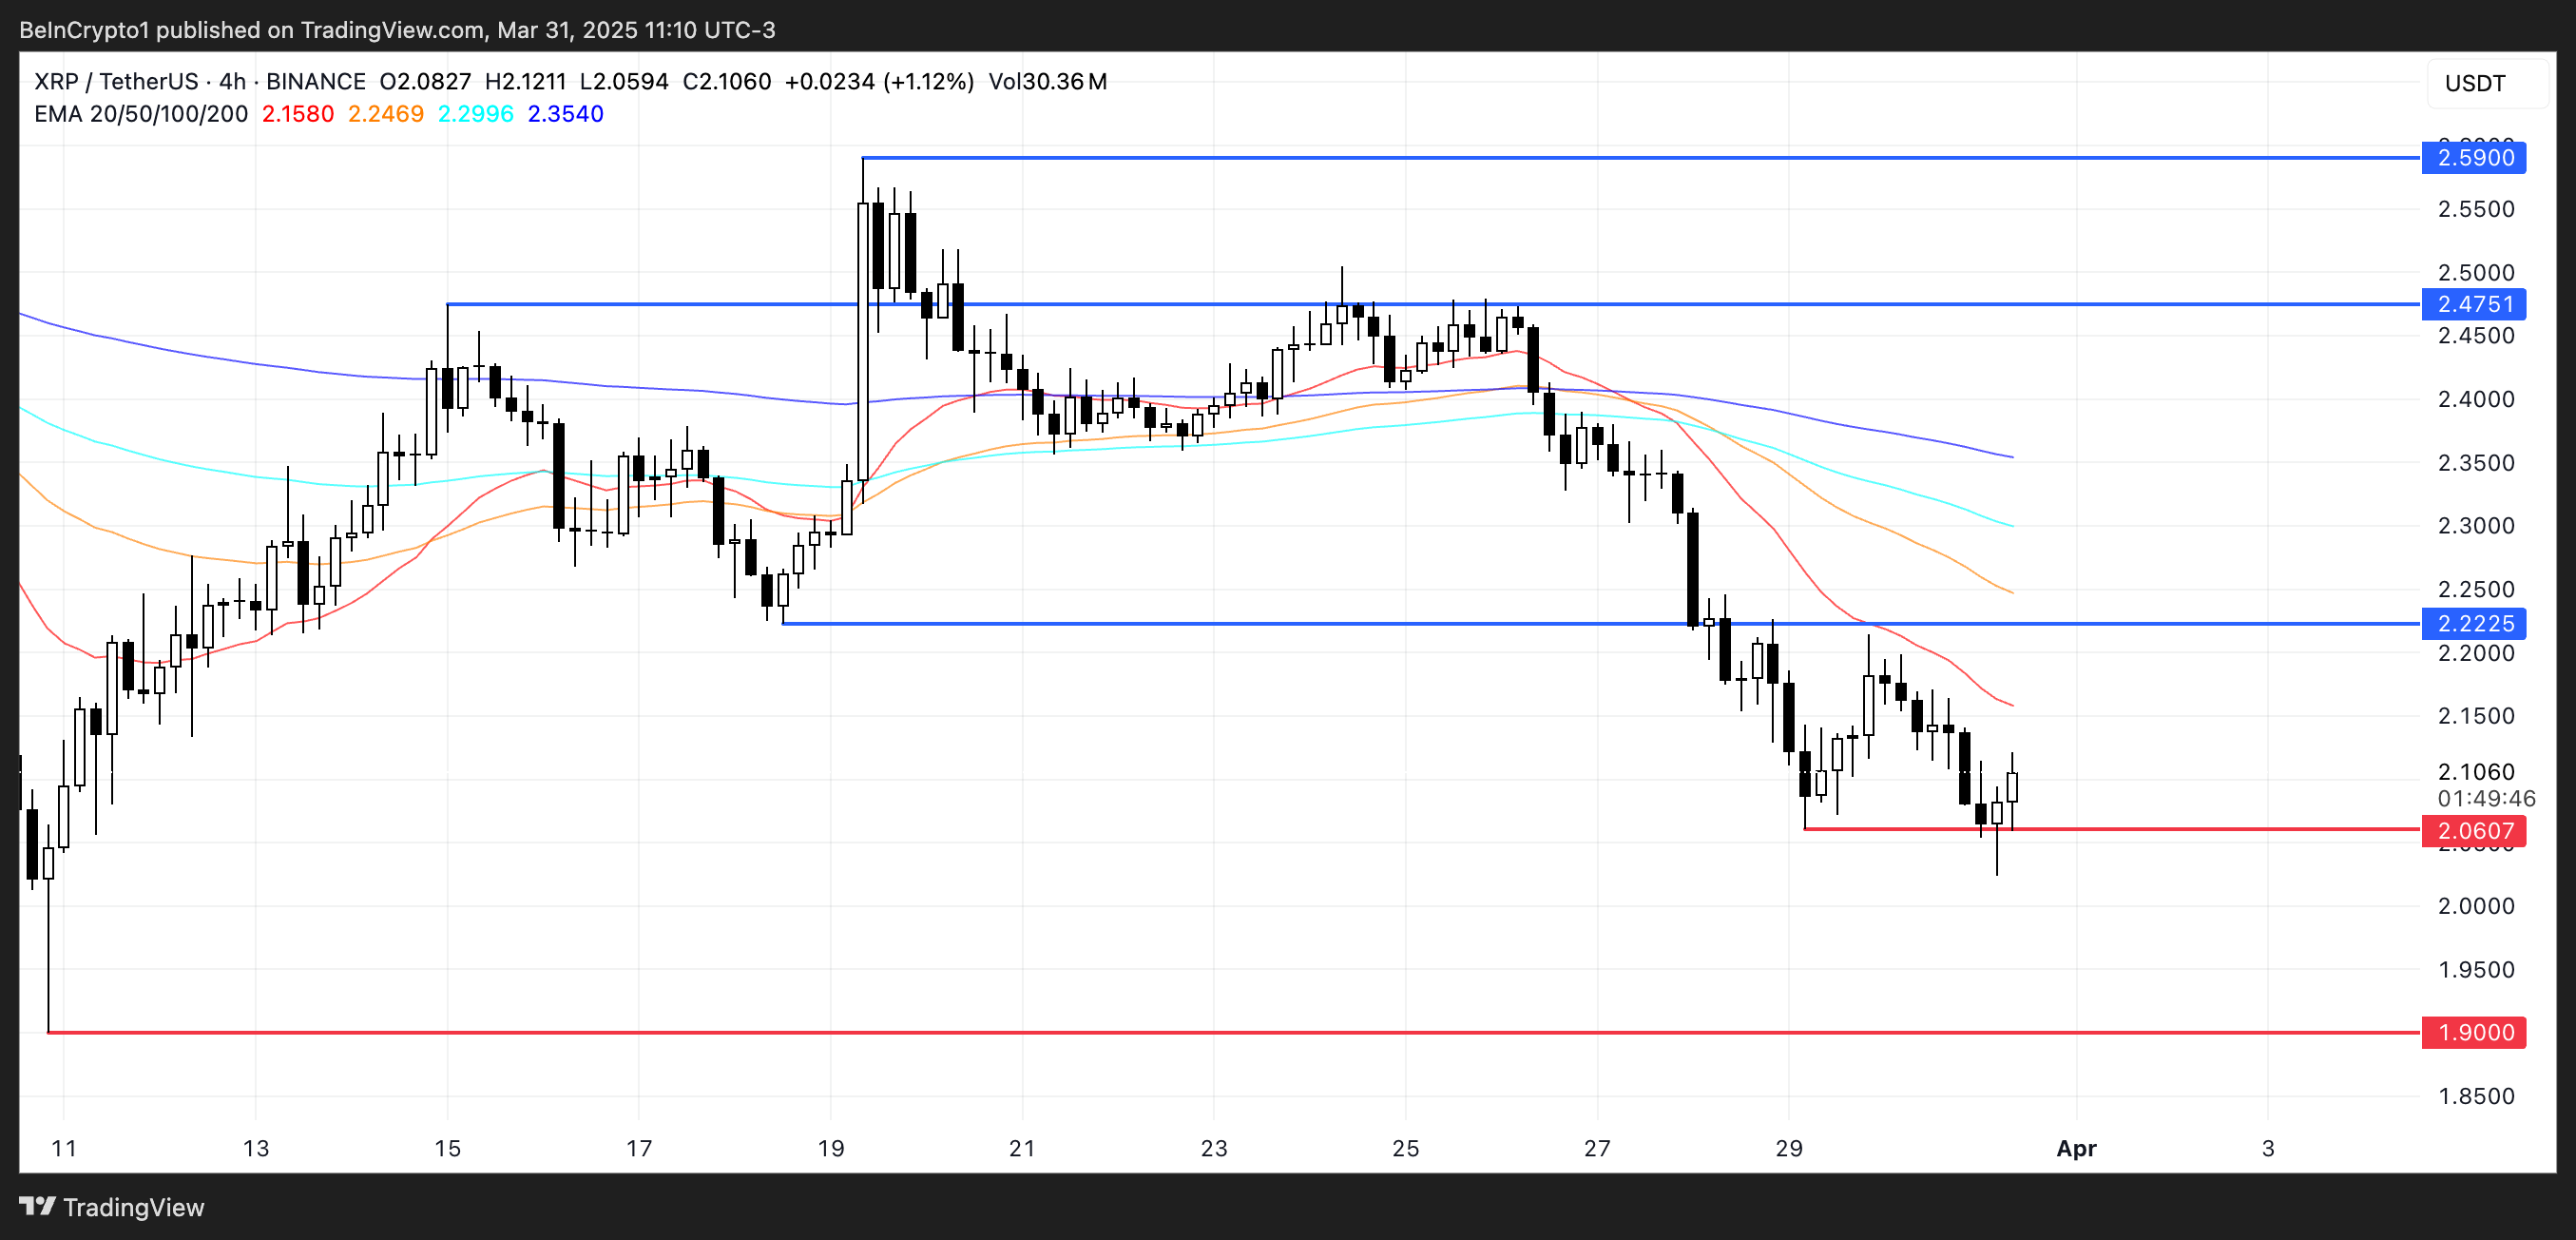 XRP Price Analysis. Source:
TradingView.
XRP Price Analysis. Source:
TradingView.
If the trend begins to shift and XRP breaks above the short-term EMAs, the first key resistance to watch is at $2.22. A successful move above this level could trigger a stronger recovery, potentially pushing the price toward $2.47.
If bullish momentum continues, the next upside target would be $2.59. For now, though, the EMA structure still leans bearish. XRP would need sustained buying pressure to flip the trend and aim for those higher resistance levels.
Disclaimer: The content of this article solely reflects the author's opinion and does not represent the platform in any capacity. This article is not intended to serve as a reference for making investment decisions.
You may also like
Shiba Inu Slides to Two-Month Low as Trump Downplays Iran Truce
Bitcoin’s LTH Spending Signals New Accumulation Phase
Long-Term Holder spending hits minimum, aligning with Bitcoin accumulation and potential price growth.Bullish Indicators Add Strength to Price Outlook

US Ethereum ETFs Hit Record 3.91M ETH Reserve
: U.S. spot Ethereum ETFs reach a record 3.91M ETH, with BlackRock holding the largest share at 41%.BlackRock Leads, Grayscale FollowsInstitutional Adoption Gaining Momentum

Missed Ethereum’s ICO? Qubetics at $0.3370 Stands Out Among Best Cryptos to Buy This Month
Missed Ethereum’s early rise? Qubetics is in its final presale stage, offering real utility, reduced supply, and up to 4,349% ROI potential. Discover the best crypto to buy this month.Qubetics Interoperability: Cross-Network Access Without ComplexityEthereum’s Legacy and Qubetics’ PromiseThe Bottom Line
