FLOKI Surges 10%—Can It Break Key Resistance Levels?
- FLOKI price jumped over 10%, reaching $0.00007603 before settling at $0.00007112.
- FLOKI’s CMF at 0.17 signals strong capital inflow, reinforcing bullish momentum.
As the cryptocurrency market begins to signal recovery anticipation builds for the next bull run. Consequently, meme coins are once again gaining traction with Dogecoin (DOGE), FLOKI, Shiba Inu (SHIB), Official Trump (TRUMP), and PEPE turned slightly green. Among them, FLOKI has been making waves with a significant price surge, drawing increased attention in the crypto market
Over the past 24 hours, FLOKI saw a strong upward move, climbing over 10% from a low of $0.00006872 to a high of $0.00007603. However, it has since slightly retraced to around $0.00007112, at the press time. This surge was accompanied by a 98% jump in daily trading volume reaching approximately $169.66 million.
Looking at the weekly performance, FLOKI has gained about 15%, though it still trades around 79% below its all-time high. The price action suggests a period of re-accumulation, with FLOKI recently breaking past a long-term resistance level, which has now turned into support. This is a bullish signal, indicating potential for further upside.
FLOKI Technical Indicators Support a Bullish Outlook
On the 4-hour chart, technical indicators support the positive outlook . The Relative Strength Index (RSI) sits at 58.92, showing bullish momentum without being overbought. The MACD indicator also signals upward movement as it trades above the signal line. Zooming in, the Chaikin Money Flow (CMF) at 0.17 reflects strong buying pressure. These factors point to a healthy trend.
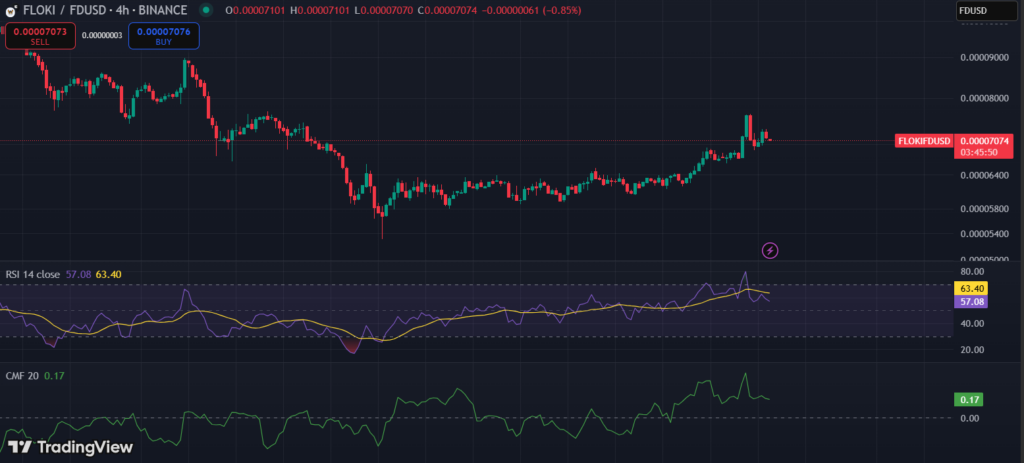 (Source: TradingView )
If the FLOKI price holds above $0.000070 another upward push could be on the horizon. FLOKI is currently testing key resistance at $0.000085 and $0.000097. However, failure to maintain a range above $0.000070 level might lead to a drop toward $0.00006159 or even $0.00005693 if selling pressure intensifies.
FLOKI is currently in a strong position, with bullish indicators supporting further gains. However, a breakout above resistance or a dip in buying momentum could lead to short-term corrections. A sustained move above $0.000085 could signal the next leg up, while a drop in volume or a bearish MACD crossover might indicate a pullback.
Highlighted Crypto News Today:
Donald Trump Set to End IRS DeFi Tax Rule After Senate Vote
Disclaimer: The content of this article solely reflects the author's opinion and does not represent the platform in any capacity. This article is not intended to serve as a reference for making investment decisions.
You may also like
Research Report|Tagger Project Overview & TAG Token Valuation Analysis

XRP price holds above $2 as SEC delays Franklin Templeton XRP ETF

VanEck Solana ETF Gets DTCC Listing as Approval Comes Close