Pi Network Outlook: Bearish Pressure and Weak Demand Spells Trouble for PI

While PI has seen a slight uptick, bearish technical indicators signal that the token may face further losses, potentially dropping to $0.62 if key support levels fail.
PI has recorded a modest 1% gain in the past 24 hours, mirroring the broader market rally during that period.
However, despite this short-term uptick, key technical indicators suggest that the token remains under significant bearish pressure, with further losses on the horizon.
PI’s Buying Pressure Fades as Bearish Signals Dominate
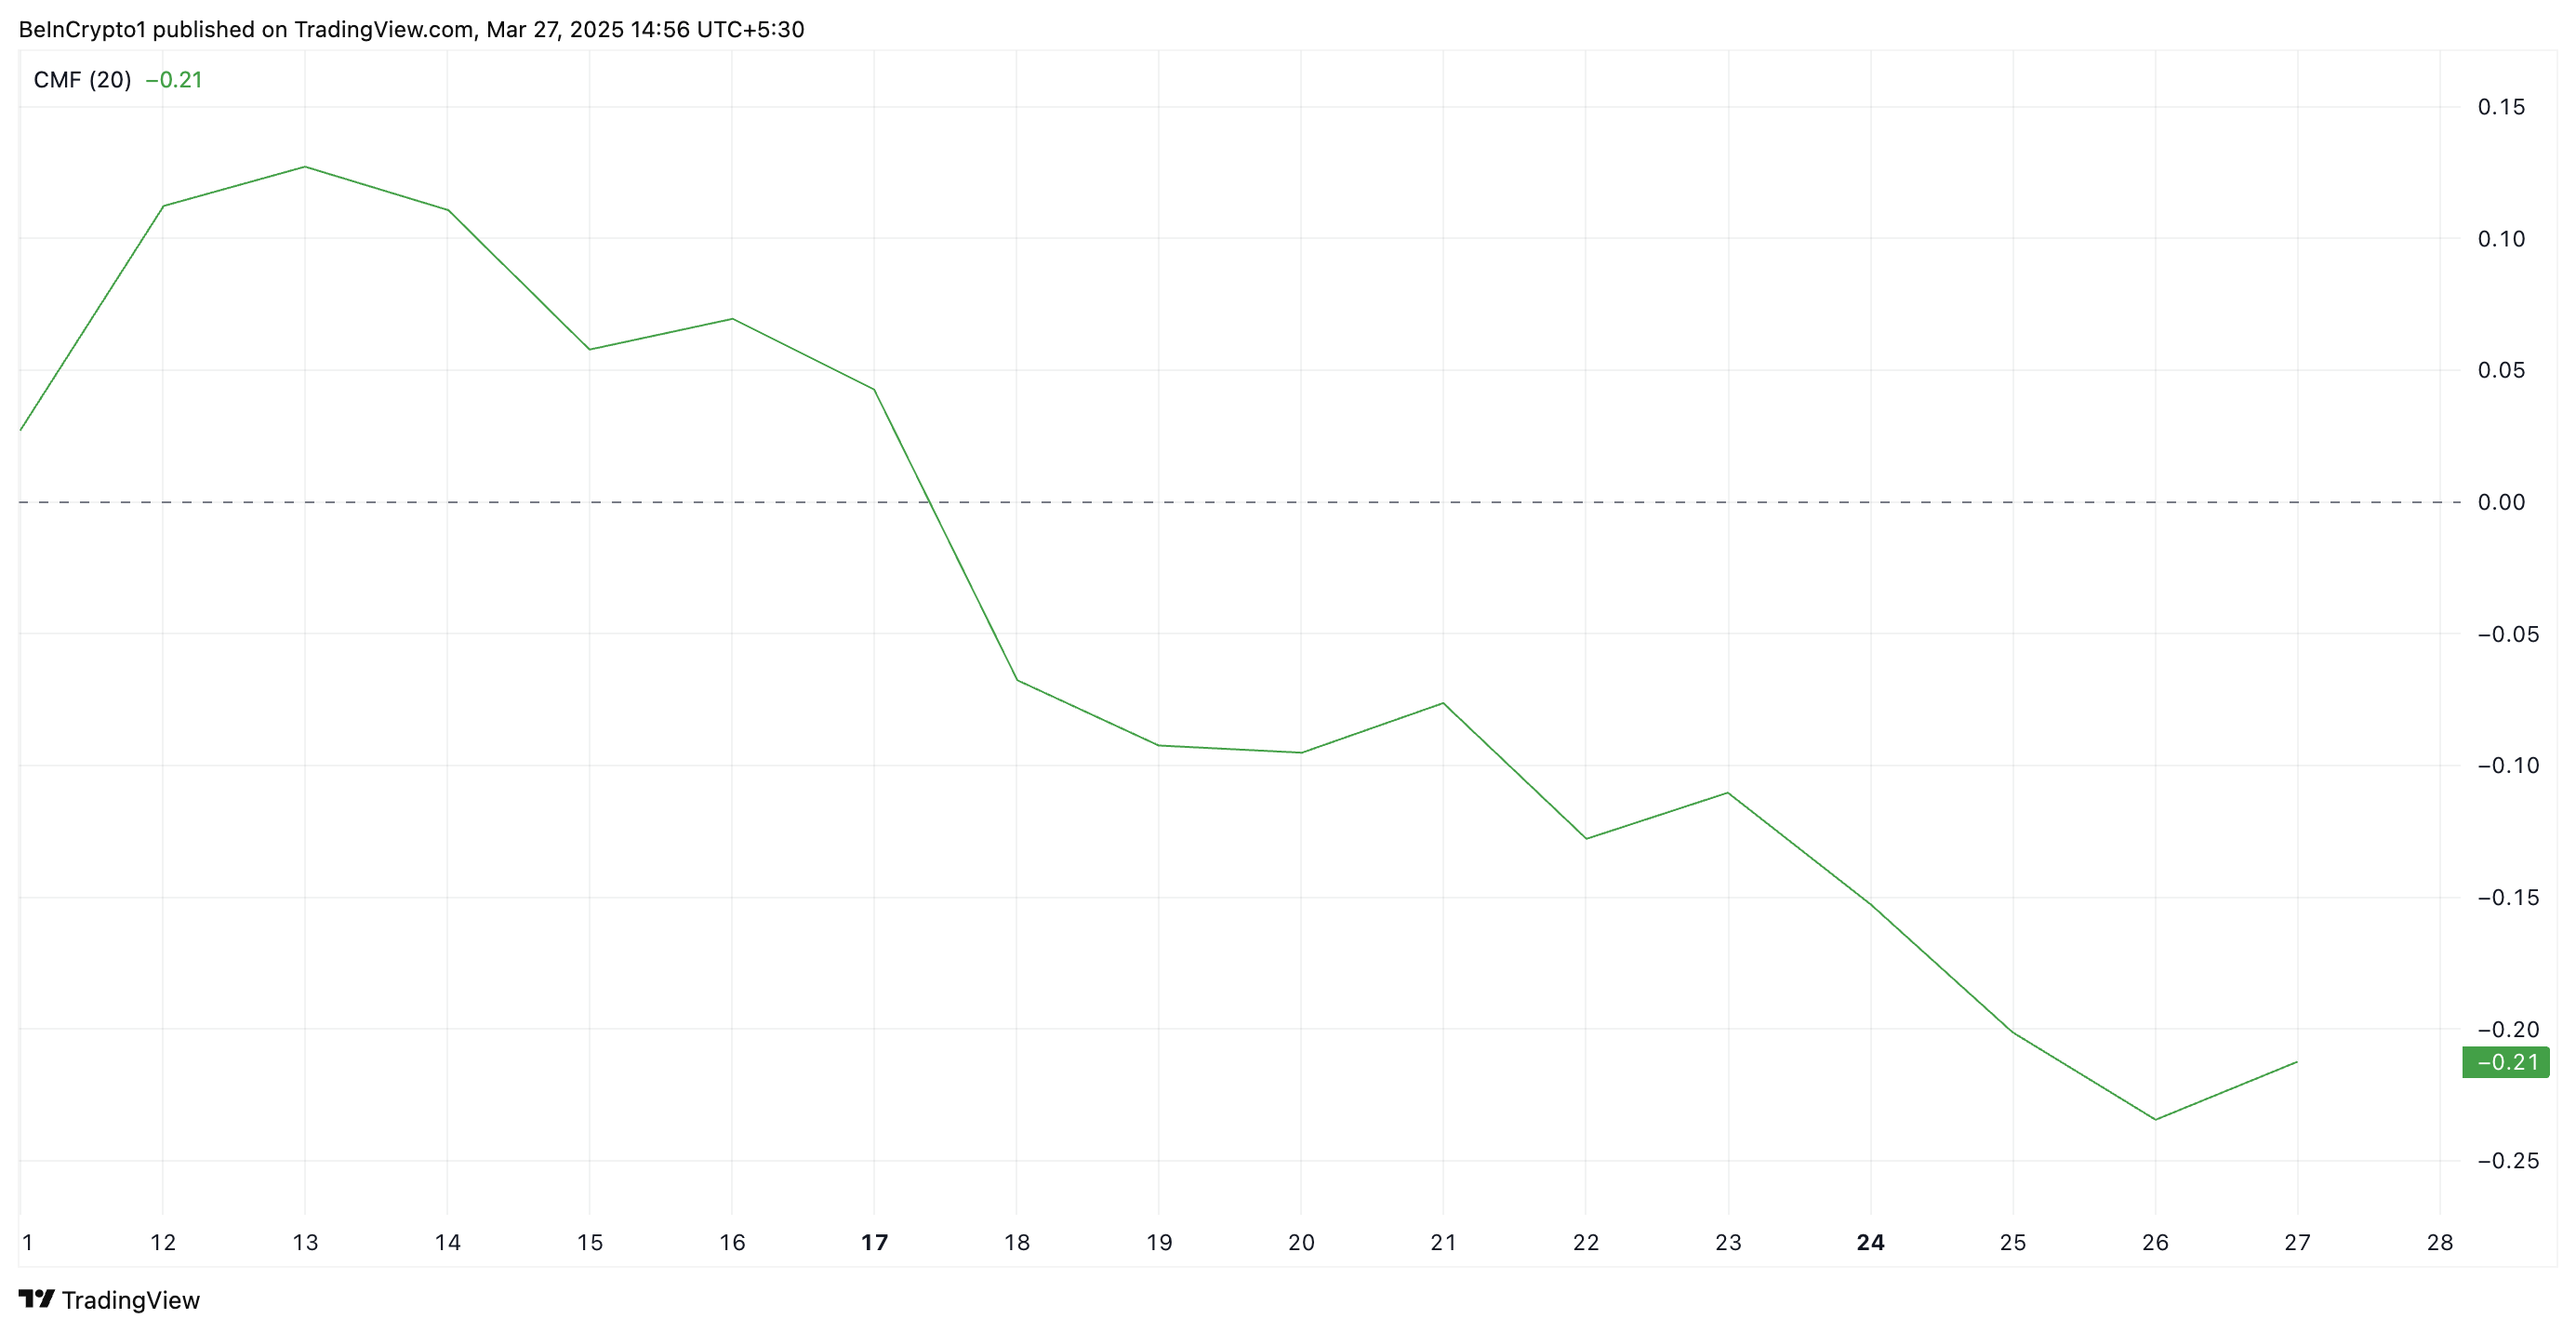
PI’s Chaikin Money Flow (CMF) has maintained a downward trend since March 14, reflecting the weak buying activity among market participants. At press time, the indicator, which tracks how money flows into and out of an asset, is below zero at -0.21.
 PI CMF. Source:
TradingView
PI CMF. Source:
TradingView
When an asset’s CMF declines and falls below zero, it signals weakening buying pressure and increasing selling momentum. It indicates that capital is flowing out of PI as traders intensify profit-taking efforts, exacerbating its price decline.
The sustained drop below zero reinforces this bearish outlook and hints at further price declines as long as PI sellers remain dominant.
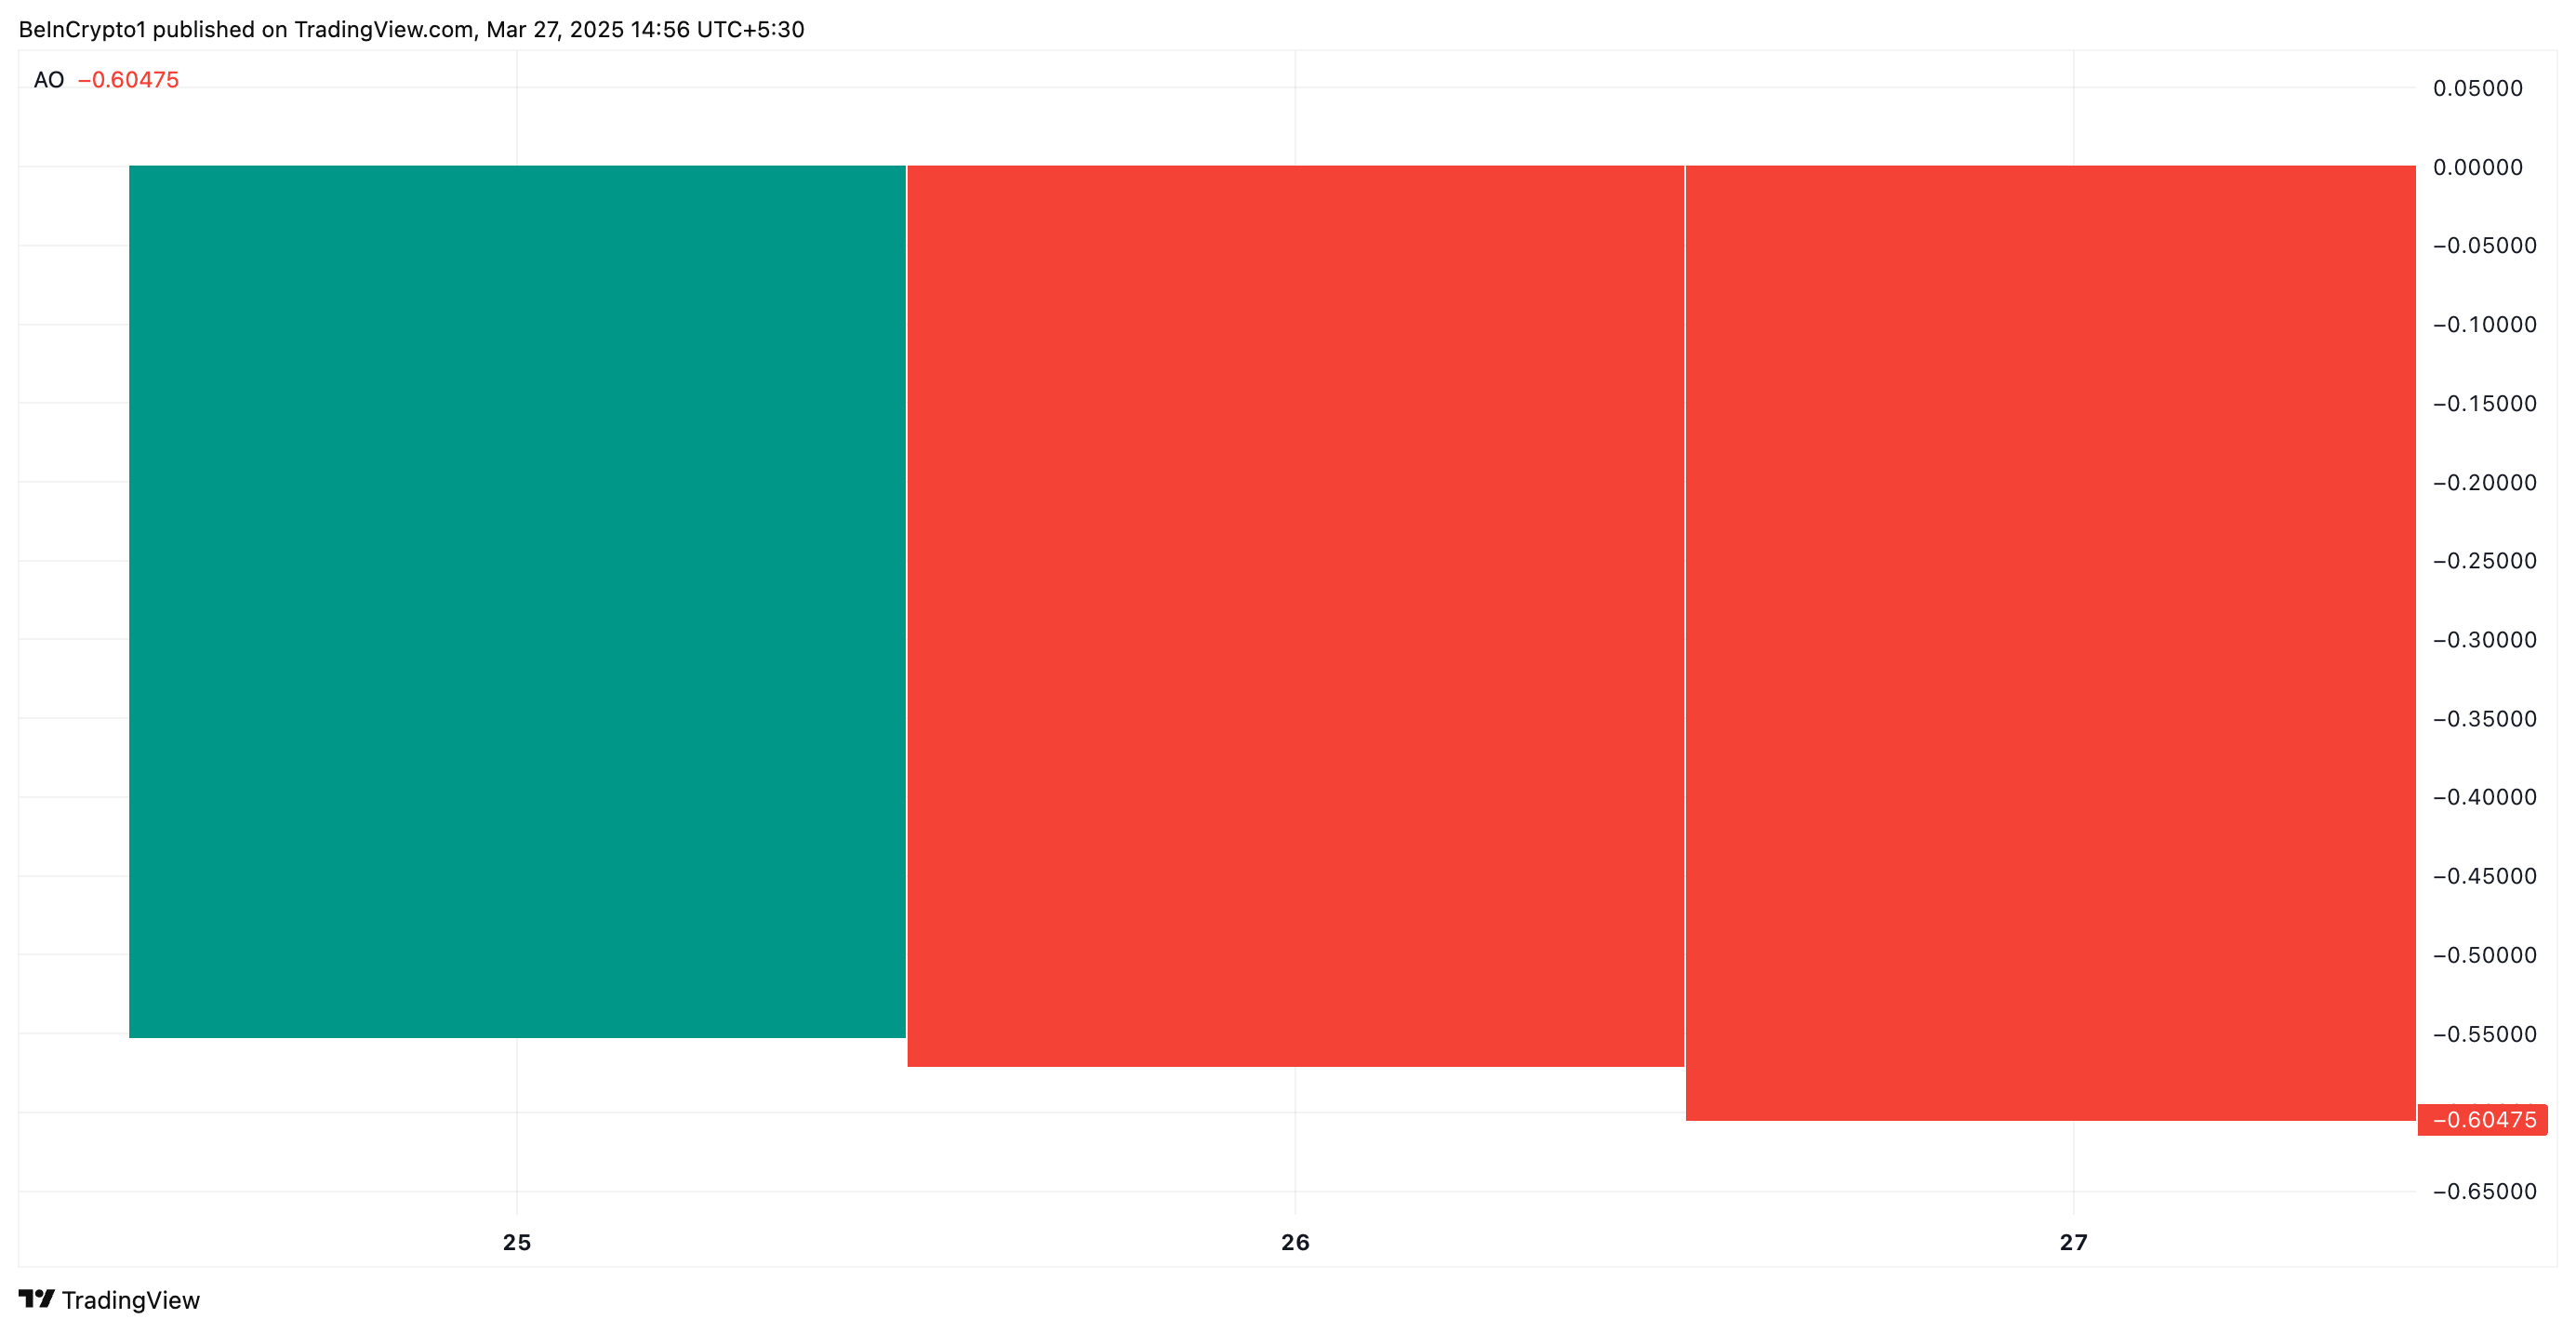
Further, PI’s Awesome Oscillator (AO) has returned a red histogram bar, with its value at -0.60. The indicator tracks short- and long-term moving averages to confirm or deny market trends. It helps traders assess whether bullish or bearish momentum is strengthening or weakening.
 PI Awesome Oscillator. Source:
TradingView
PI Awesome Oscillator. Source:
TradingView
When the AO returns a red bar, the current histogram value is lower than the previous one, signaling an increase in bearish pressure. Traders use this as an early warning to exit long positions or prepare for a possible market reversal.
Multiple red bars are starting to appear consecutively on the PI/USD one-day chart, indicating that the buying strength in its spot markets is fading fast.
PI at Make-or-Break Level—Will It Plunge to $0.62?
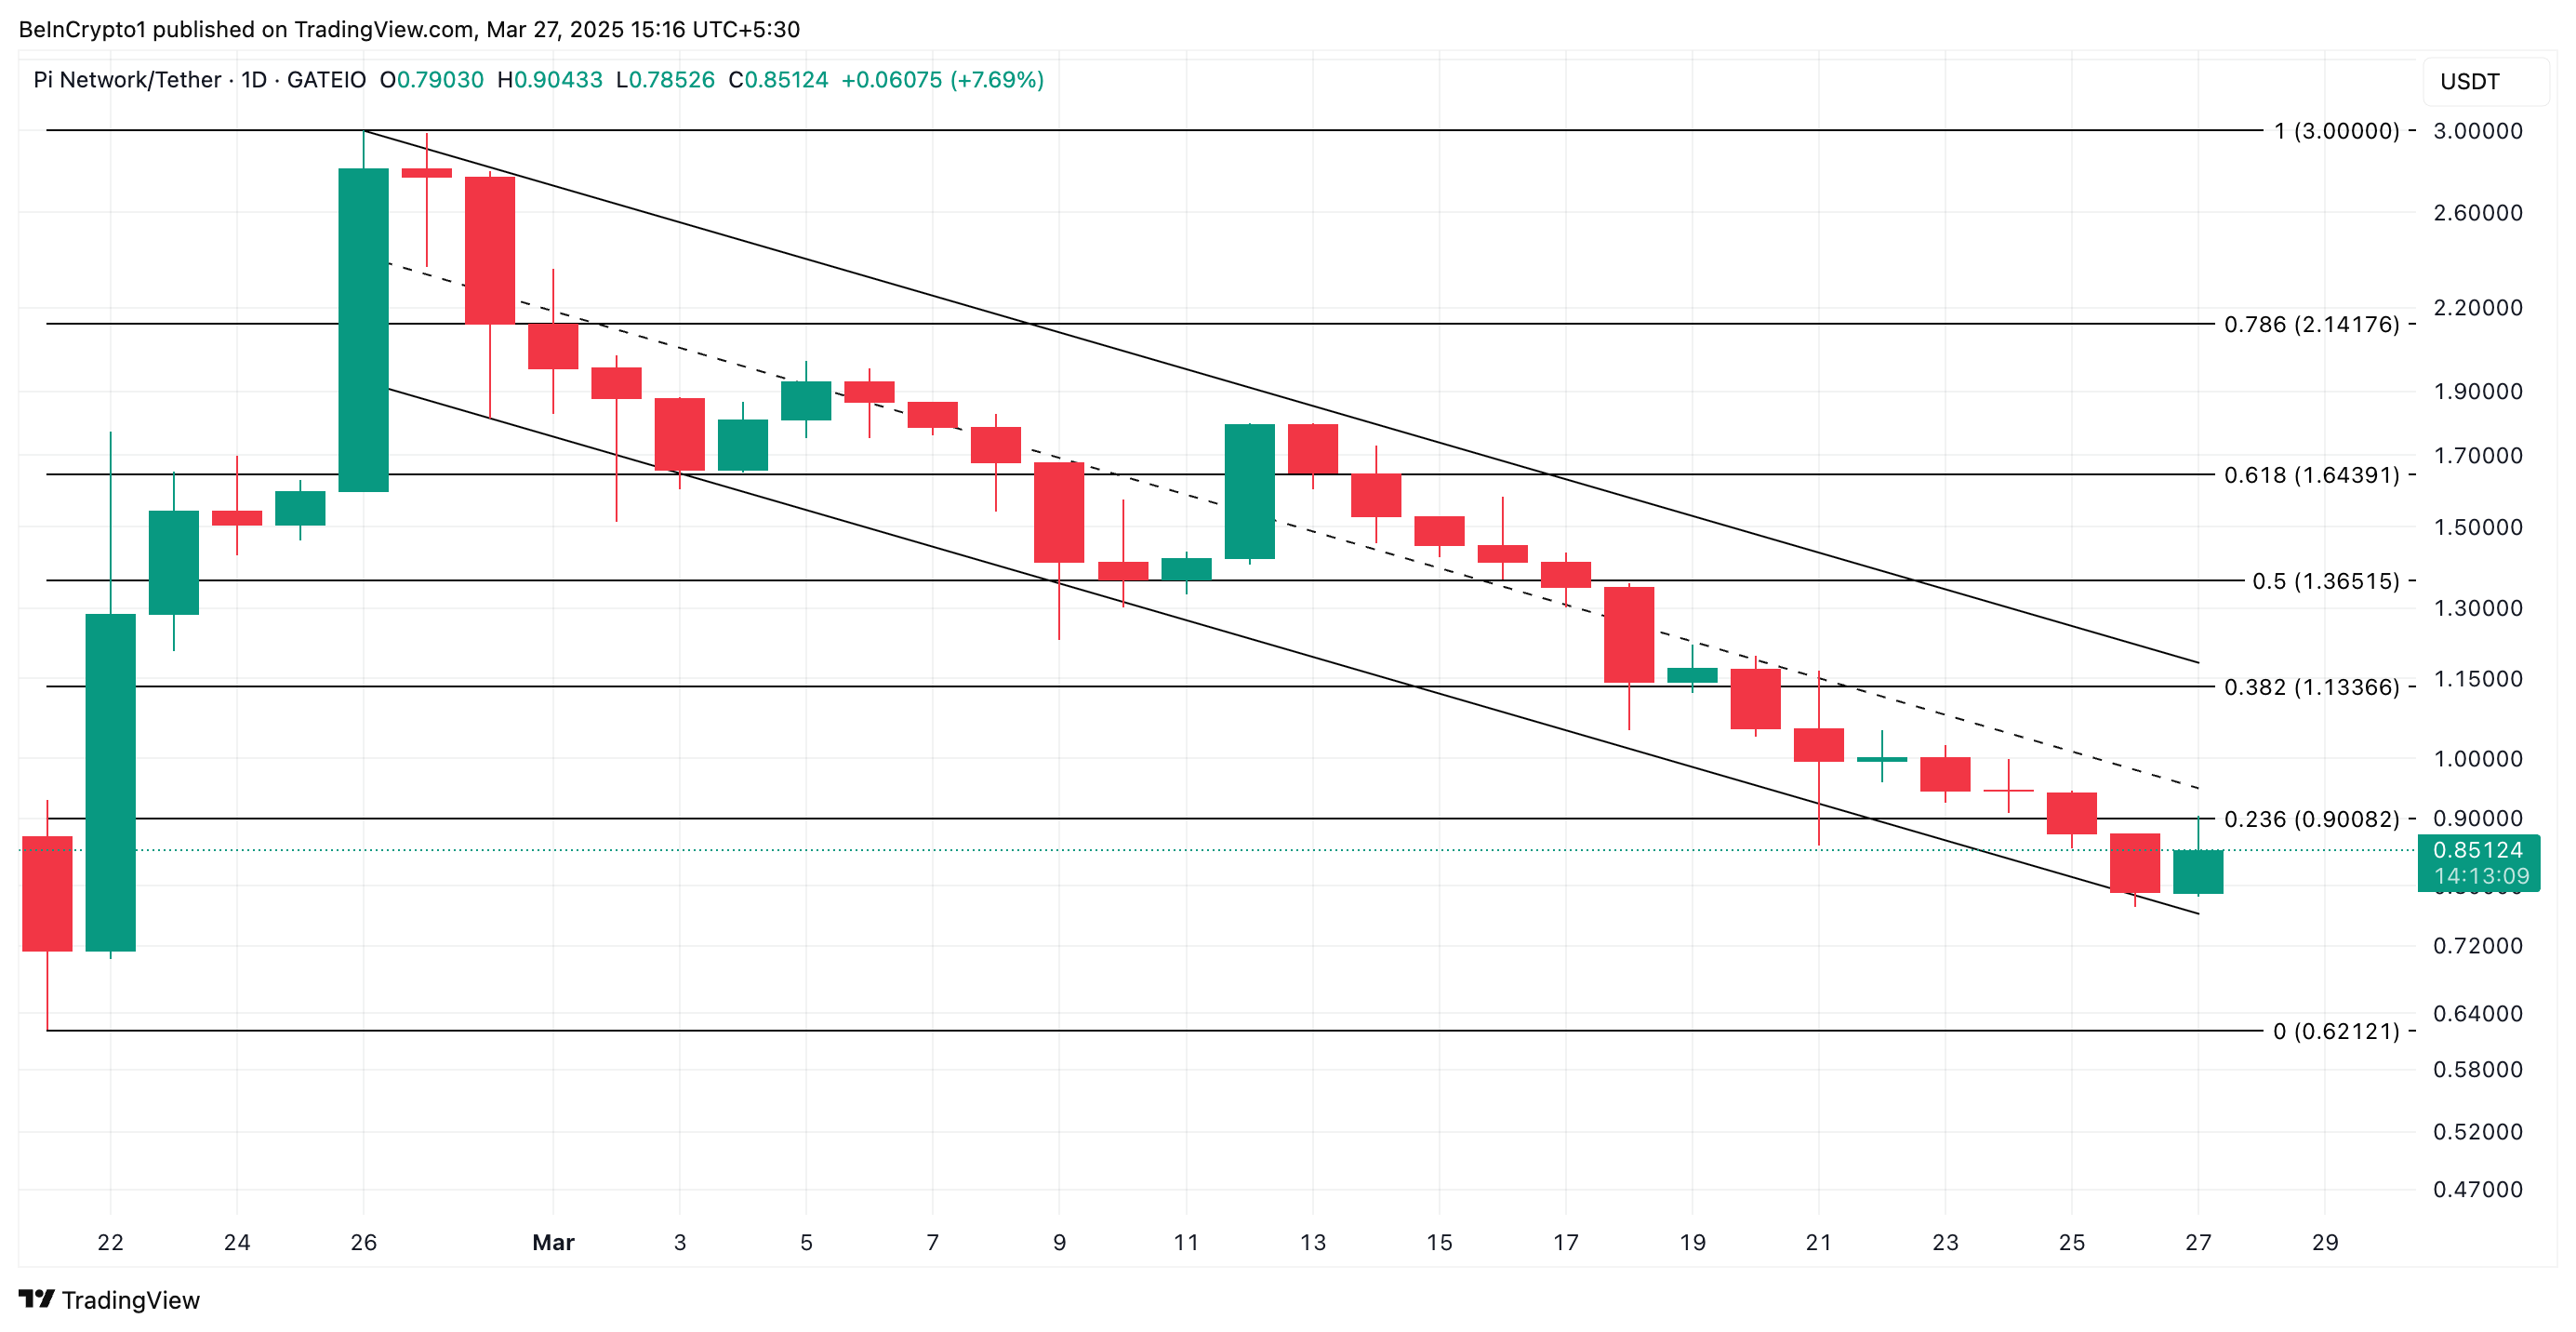
PI continues to trade within its descending parallel channel as sellers strengthen their control. At press time, PI trades at $0.85, near the lower trend line of this channel, which forms a key support floor.
The channel emerges when an asset’s price moves between two downward-sloping parallel trendlines, indicating a sustained bearish trend. If the price is poised to break below the lower trendline, it signals intensified selling pressure and an acceleration of the downtrend, which could lead to further losses.
If PI breaks below this support floor, it would add more downward pressure on its price and could force it to drop to $0.62.
 PI Price Analysis. Source:
TradingView
PI Price Analysis. Source:
TradingView
On the other hand, a bullish trend reversal would prevent this. If PI demand soars, its price could rally past $0.90.
Disclaimer: The content of this article solely reflects the author's opinion and does not represent the platform in any capacity. This article is not intended to serve as a reference for making investment decisions.
You may also like
Uniswap front-end transaction fees have reached $182.88 million
Trump Exempts Tech Devices from New Tariffs
Trump exempts smartphones, computers, and chips from new tariffs, easing pressure on the tech and crypto industries.Major Tech Relief as Trump Exempts Devices from TariffsCrypto Sector Also Stands to BenefitPolicy Shift Aims to Stabilize Markets

Can You Still Mine Bitcoin at Home in 2025?
Discover four practical ways to mine Bitcoin at home in 2025, from USB miners to compact ASIC rigs.USB Bitcoin Miners: For Hobbyists and LearnersHome-Friendly ASICs: Efficiency in a Small PackageHosted Mining at Home: Remote Hardware, Local ControlRenewable-Powered Rigs: Go Green, Save CostsFinal Verdict: Feasible, But Strategic

Shaq Settles $11M NFT Suit, BTC Eyes $100K by June
Shaquille O’Neal settles $11M NFT lawsuit, while Bitcoin eyes a $100K rally by June. Here’s your weekly crypto recap.Shaq to Pay $11M in Astral NFT Lawsuit SettlementBitcoin Eyes $100K by June, Says Analyst ConsensusMarket Roundup: Bullish Across the Board