VET and XTZ Approaches Falling Wedge Resistance – Could Breakout Spark a Recovery?

Date: Sun, March 16, 2025 | 04:40 AM GMT
The cryptocurrency market is showing signs of stabilization as Bitcoin (BTC) has bounced back from its recent dip near $76,000 and is now trading around $84,000. This positive shift is giving altcoins a much-needed boost— to tokens like Vechain (VET) and Tezos (XTZ), both of which have suffered heavily over the last 90 days.
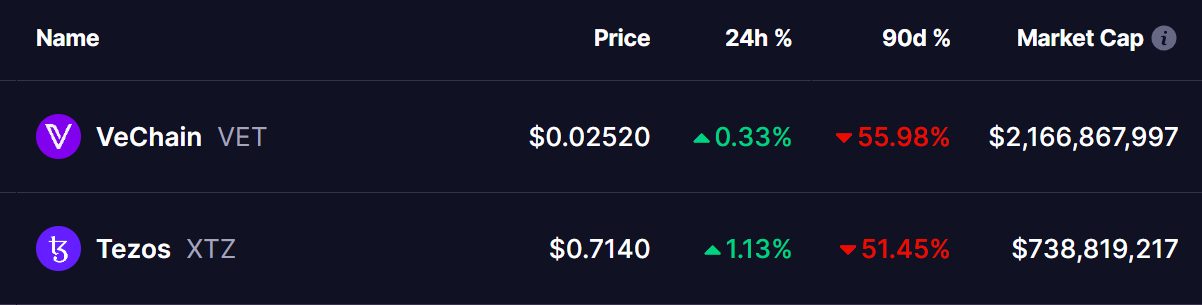 Source: Coinmarketcap
However, as the market stabilizes, both tokens are approaching key resistance levels within their respective falling wedge patterns. A potential breakout could signal the beginning of a strong recovery for both assets.
VeChain (VET) Analysis
VET’s daily chart highlights a clear falling wedge pattern that began after its rejection from the December 3 high of $0.080. Since then, the token has dropped more than 68%, hitting a low of $0.021 on March 11.
But momentum seems to be shifting. VET has climbed back to $0.025, now pressing against the upper boundary of the wedge. A breakout above this resistance—ideally confirmed with a successful retest—could open the door for a move toward $0.036, which aligns with the 50-day moving average (MA).
If the rally gains strength, VET could aim even higher—toward the $0.048 zone, near the 100-day MA. That would mark a potential 92% gain from current levels.
Tezos (XTZ) Analysis
XTZ has followed a similar trajectory. After peaking at $1.90 in early December, the token dropped over 68%, bottoming out at $0.61 on March 11.
Currently trading around $0.7145, XTZ is edging closer to breaking out of its own falling wedge pattern. A successful breakout and retest could push the price toward the $0.92 resistance level, in line with its 50-day MA.
If bullish momentum continues, the next target could be $1.13, near the 200-day MA—representing a potential 57% rally from current prices.
What’s Next for VET and XTZ?
Both tokens are now at crucial technical junctures. Falling wedge patterns are often early indicators of a reversal, but confirmation with volume and follow-through is key. Traders will be watching closely for decisive breakouts.
While technicals look promising, broader market sentiment, Ethereum’s next big move, and macroeconomic factors will still play a significant role in shaping what comes next.
Disclaimer: This article is for informational purposes only and does not constitute financial advice. Always do your own research before making any investment decisions.
Disclaimer: The content of this article solely reflects the author's opinion and does not represent the platform in any capacity. This article is not intended to serve as a reference for making investment decisions.
You may also like

Is ADA the Sleeper Pick for the Next Bull Run? Hoskinson’s $250K BTC Forecast Says Yes
Hoskinson predicts that rate cuts and the stabilization of the recent tariff war will send the crypto market much higher.

$3 Billion XRP Volume Spike – What Do Whales Know That You Don’t?
XRP could be primed for a breakout above its recent downtrend. Here's how high it could go.

Bitcoin traders target $90K as apparent tariff exemptions ease US Treasury yields
Bitcoin bulls predict a rally to $90,000 if Treasury yields continue to fall alongside the Trump administration’s adjustments to its current tariff policy.