ADA Price At Key Support: What Lies Ahead For Cardano?

Cardano’s key support zone ranges from $0.80 to $0.66. Staying above this range could trigger a bullish movement. ADA charts show a bearish outlook.
Cardano (ADA) price currently holds essential ground between $0.80 and $0.66. Experts highlight that this zone may control ADA’s future movement.
ADA price has relied heavily on this support area throughout its market cycle as a dual-function boundary between resistance and support phases.
Expert Ali’s analysis shows that this price area represents a crucial market space. According to the chart, price action within this specific range has resulted in essential price pushback and powerful upward movements.
If ADA maintains positions above this price zone, an extended uptrend may become more assertive. Should prices drop below this range, they will signify that downside acceleration may happen.
Cardano Prices Still Struggling Despite Positive Technical Indicators
The price levels across support and resistance indicate that $0.66 is the primary support level. $0.55 serves as backup support if the price area fails to maintain stability.
The initial resistance point is $0.80, and the primary resistance is $1.10. According to the chart, the primary support point exists at $0.66 before the secondary support at $0.55 appears.
ADA may experience an upward price surge to reach $1.10. This is if traders resist this support level effectively.
Despite the rally scenario, Cardano (ADA) was priced at $0.7326, showing a 1.38% decline over the past 24 hours.
The market cap is $25.81 Billion, down 1.37%, while the fully diluted valuation (FDV) is $32.92 Billion. Despite the price drop, 24-hour trading volume has increased by 9.85% to $2.06 Billion.
This reflects active market participation. Recent price movements indicate a decline from $0.7428, followed by a partial recovery.
This could suggest some buying interest after the dip, but the strong prevailing market conditions, which still have the coin down over the last day, could slow this down.
ADA Price Action Looking Uncertain
Looking at technical charts, we see that despite its temporary rise, ADA maintains a bearish outlook. It sits below its 50-day EMA at $0.8172 and its 100-day EMA at $0.8158.
The recent price breakdown triggered sharp selling pressure, which caused the market to sell off. Market price has shown various failed upward recovery efforts.
This is due to resistance areas between $0.90 and $1.10 generating a substantial market decline. Current price patterns show that support between $0.66 and $0.70 remains stable during the recent recovery.
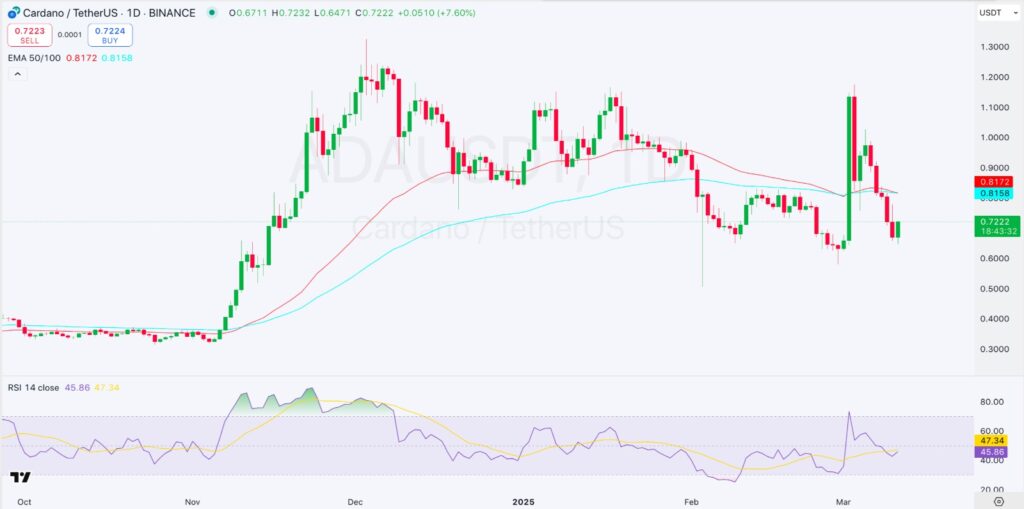 1-day ADA/USDT Chart | Source: TradingView
The Relative Strength Index (RSI) currently stands at 45.86. This value indicates that ADA is near neutral yet lacks intense buying pressure.
The RSI signal line cross indicates that ADA might be attempting a recovery phase. ADA could have limited bullish potential only if it breaks through 50 while demonstrating increasing trading volume.
A lasting bullish ADA trend can only develop after ADA climbs above its 50-day and 100-day EMAs. Failure to break through those levels could drive the ADA price to rest at support zones at $0.60 and $0.55.
Disclaimer: The content of this article solely reflects the author's opinion and does not represent the platform in any capacity. This article is not intended to serve as a reference for making investment decisions.
You may also like
Pump DEX’s 24-hour trading volume is $777 million, surpassing Raydium to rank second
Putin: No special military action has been prepared to seek a peaceful solution to the Donbass issue
Pro-crypto Democrats pull support for stablecoin bill in last minute