Solana Price Struggling, But This Indicator Hints At Possible Recovery

Solana could be on the verge of a breakout. The following support level is $125. SOL price chart shows signs of increasing bear pressure.
Despite recent analyst predictions, Solana’s (SOL) price has approached yearly low levels. This suggests prices may recover minimally in the upcoming days.
However, despite the bearish outlook, analyst Ali pointed out that Solana could face a potential recovery from the current prices.
According to recent analysis , the $125 support level requires close monitoring since it will determine Solana’s trading path.
The $125 price mark has established itself as Solana’s key support zone. This can be viewed as a numerical or psychological threshold that shapes forthcoming market feelings and movement.
Since it improves market confidence, the cryptocurrency market shows increasing bullish signals when traders maintain trading positions above this level.
Solana Price Struggling for Gain
The SOL price movement in recent times reveals significant downward market trends through its pattern on price charts.
Solana’s price peaked in December before it dropped substantially while forming multiple descending trend patterns that usually indicate bearish market conditions.
Throughout this selling period, investors maintained their sales activities because the candlestick pattern shows extended red movement, which denotes intense selling pressure.
The price has now breached below its long-term support levels as seen in 1-day charts, sparking fears of further declines.
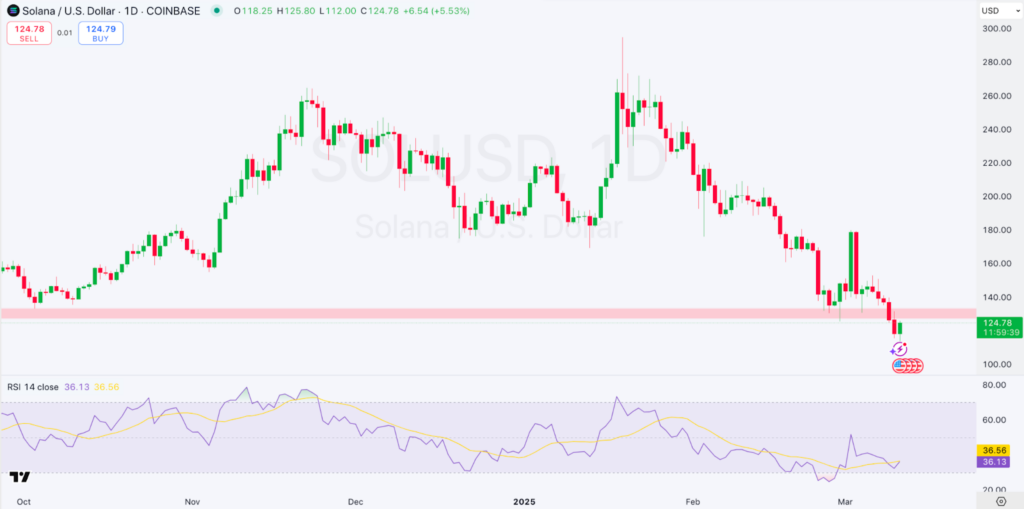 1-day SOL/USD Chart | Source: TradingView
The Relative Strength Index (RSI) indicates asset overselling as its value remains under the 40-point mark.
The current state of market momentum demonstrates minimal potential for substantial upward price adjustments during the short term.
Its current position reflects the bearish market sentiment while strengthening the prevailing negative price trend.
A support area exists at $120. Historical evidence shows buyers actively participate at this level. The critical area at $120 defines whether the Solana price will recover and change direction or if downward momentum will push prices toward $100.
The price must demonstrate a solid overcoming of this support area before any bearish momentum would force a decline, potentially reaching the $100 level.
SOL Facing Sell-offs?
According to CoinMarketCap data, the trading volume, as seen in the second image, has spiked recently, often a signal of increased interest and activity.
High volume accompanying a downward price movement can sometimes indicate a capitulation phase where sellers want to exit their positions.
If buyers buy in at lower prices, this could lead to a temporary bottom. The volume spike could be pivotal if Solana’s price reaches the support zone, providing a litmus test for the asset’s short-term trajectory.
SOL’s current technical setup paints a bearish picture in the near term, with vigorous selling activity and key technical indicators supporting this view.
The subsequent few trading sessions will be crucial, particularly regarding how the price interacts with the critical support at the $120 level.
A rebound from this point could signal a temporary respite or reversal, whereas a break below could exacerbate the downward trend.
Disclaimer: The content of this article solely reflects the author's opinion and does not represent the platform in any capacity. This article is not intended to serve as a reference for making investment decisions.
You may also like
AI16Z token launches Auto.fun this week

NVIDIA plans $500 billion AI factory buildout in US

Crypto funds lose $795 million amid tariff uncertainty

Tether invests $500 million in decentralised Bitcoin mining