- Pi (PI) surpasses HBAR in market cap, but declining volume raises concerns.
- HBAR faces bearish pressure, struggling to hold key support at $0.230.
- Pi’s price recovery hinges on breaking $1.85 resistance for further upside.
Pi (PI) has overtaken Hedera (HBAR) in market capitalization, sparking discussions about whether this shift signals long-term strength or is just a fleeting moment of hype.
While Pi’s price has edged up, HBAR is facing a noticeable price decline. This raises questions about investor sentiment and whether this trend will continue.
Analyzing Pi’s Price Action: Volatility & Key Levels
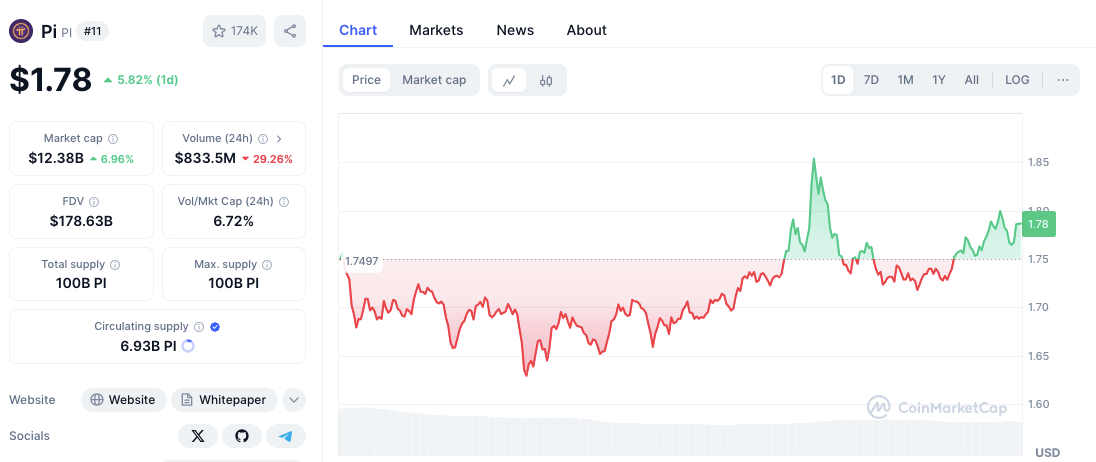
Pi’s price currently sits at $1.79 , showing a 1.99% increase over the last 24 hours. Its market cap has reached $12.41 billion, but trading volume has decreased by 26.98% to $845.56 million. This suggests that while the price is stable, investor activity may be slowing down.
The price chart illustrates some volatility, with an initial dip followed by a gradual recovery. A push from buyers recently lifted the price above $1.85, but resistance at that level led to a pullback. However, current price movement suggests a possible return to an upward direction as the price rebounds from earlier lows.
 Source: CoinMarketCap
Related: Pi Coin 40% Surge: Binance Listing Fuels $4 Price Target Talk
Technical levels to watch show support around $1.65 to $1.70. At these levels, buying interest has been consistent. Conversely, the $1.85 level has proven to be a challenge to overcome. A move above $1.80 could signal another attempt to breach this resistance. However, should the price fail to stay above $1.75, it might retest the $1.70 support zone before attempting another rise.
Hedera (HBAR) Under Market Pressure
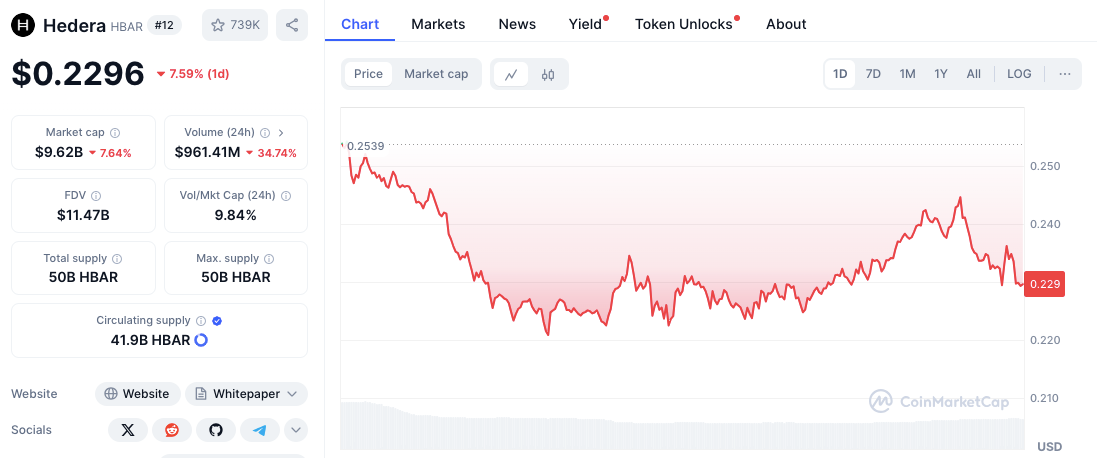
On the other hand, HBAR has encountered a downturn, with its price falling 7.47% to $0.2337 . The market cap has dropped by 8.12%, and trading volume has declined by 33.91%, signaling reduced investor activity. The daily price range extends from a high of $0.2539 to a low of $0.230, highlighting selling pressure.
 Source: CoinMarketCap
HBAR Technical Analysis: Support and Resistance Zones
Technical analysis identifies $0.230 as immediate support, with stronger support zones between $0.220 and $0.225. Should the decline persist, the next key support level is approximately $0.210.
Related: Cryptocurrency Spotlight: SEI, Solana, Arbitrum, Hedera, and Avalanche Lead Market Surge
Regarding resistance, the price needs to break through the $0.240–$0.245 zone to begin a recovery. The $0.2539 level is acting as a major breakout point. A sustained push past $0.260 could shift market momentum to buyers. However, if HBAR cannot hold above $0.230, further declines are possible.
Disclaimer: The information presented in this article is for informational and educational purposes only. The article does not constitute financial advice or advice of any kind. Coin Edition is not responsible for any losses incurred as a result of the utilization of content, products, or services mentioned. Readers are advised to exercise caution before taking any action related to the company.