IOTA Price Prediction: Is This the Start of a Major Reversal?

IOTA has been a fascinating cryptocurrency in the market, known for its unique Tangle technology, which sets it apart from traditional blockchain-based assets. However, its price performance has been volatile, with massive swings over the past few months. After reaching a high near $0.60 in December 2024, IOTA underwent a steep correction, leaving investors wondering whether it can recover.
The latest price action suggests that IOTA is attempting a strong rebound from key support levels. With a noticeable price surge above $0.24, traders and investors are questioning whether this marks the beginning of a sustained uptrend or just a temporary relief rally. In this analysis, we will examine the critical support and resistance levels, indicators, and potential price targets for IOTA in the coming weeks.
IOTA Price Prediction: What Is the Current Trend in IOTA’s Price Movement?
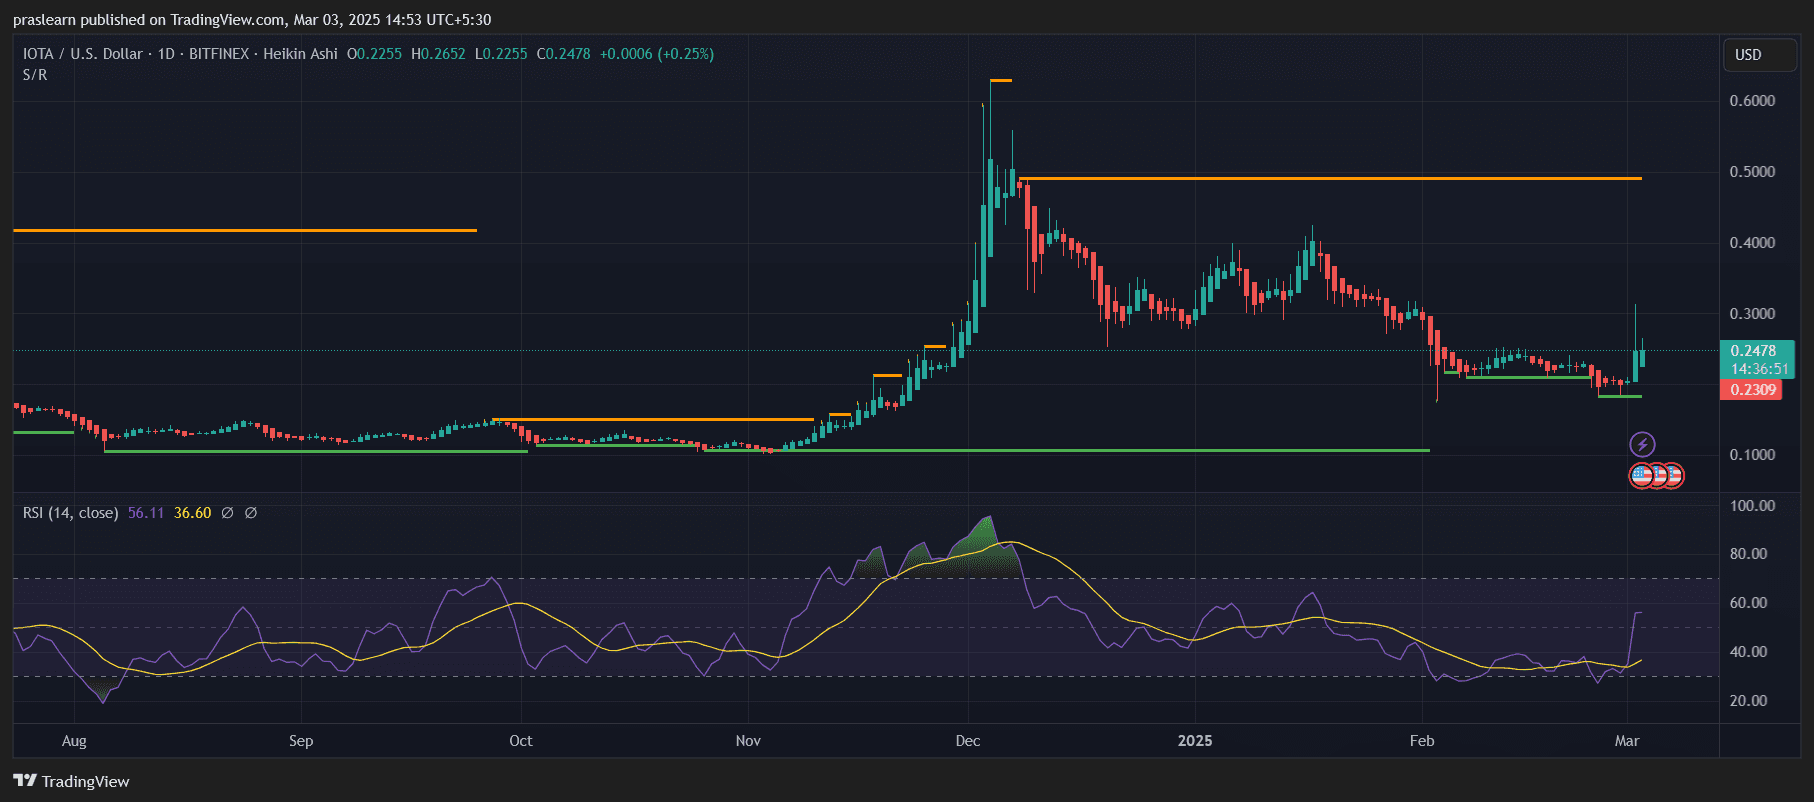 IOTA/USD Daily Chart- TradingView
The IOTA daily chart shows a strong shift in price action after a prolonged downtrend. Recently, the price tested and bounced off a critical support level around $0.12-$0.13, suggesting that buyers are stepping in aggressively. This level had previously acted as a strong base during past corrections, reinforcing its importance.
Since the bounce, IOTA has climbed above $0.24, signaling renewed bullish momentum. A key observation is that the price has broken above previous consolidation ranges, hinting at the possibility of further gains if buyers maintain control.
Has IOTA Formed a Reliable Support Zone?
Yes, the $0.12-$0.13 range has been an essential demand zone for IOTA price , where price reversals have occurred multiple times. This zone serves as a psychological level where buyers find value, making it a crucial reference point for traders.
Currently, a new potential support zone is forming around $0.20-$0.22. If IOTA holds above this area, it will provide a strong foundation for further bullish movement. However, if price action dips below this level, another retest of the lower support levels could be in play.
--> Click here to easily trade IOTA today <--
What Do the Indicators Reveal About IOTA’s Strength?
The Relative Strength Index (RSI) is currently at 56, reflecting increased buying pressure. Previously, RSI was in the oversold zone, but the latest breakout suggests a shift in momentum. If RSI moves above 70, it would indicate overbought conditions, potentially leading to a short-term correction.
Additionally, the Heikin Ashi candlesticks show a clear bullish trend, with multiple consecutive green candles forming. This further confirms the positive momentum in IOTA’s price action . The trend structure suggests that if buyers maintain pressure, IOTA could extend its rally toward the next resistance zones.
Where Is IOTA Headed in the Short Term?
If the current momentum continues, IOTA’s first major resistance zone lies between $0.30 and $0.35. Breaking this level could open the door for a further rise toward $0.40-$0.45 in the coming weeks.
However, if IOTA struggles to sustain above $0.24-$0.25, it might face a pullback toward $0.20-$0.22. If this support holds, it would serve as a potential re-entry zone for traders. But if bears regain control and price falls below $0.20, it could trigger another retest of $0.12-$0.13, which would be a key decision point for the asset.
IOTA Price Prediction: Will IOTA Retest Its Previous Highs?
For IOTA to revisit its $0.50-$0.60 peak, it must overcome multiple resistance levels. A sustained breakout above $0.35 would be the first confirmation of a larger rally. However, macroeconomic conditions and overall market sentiment will play a crucial role in determining whether IOTA can achieve this.
If Bitcoin continues its bullish trajectory, altcoins like IOTA could benefit from increased investor confidence. However, if broader market weakness persists, IOTA might experience sideways consolidation before another breakout attempt.
Key Entry and Exit Points for Traders
Entry Zones (Buy Opportunities):
- $0.20 - $0.22: Ideal re-entry zone if price pulls back and holds this support.
- Breakout Above $0.30: A successful breakout could confirm a bullish continuation toward higher targets.
Exit Zones (Take Profit Levels):
- $0.30 - $0.35: Strong resistance zone, where partial profit-taking could be considered.
- $0.40 - $0.45: A higher resistance area that could act as a near-term target.
- $0.50 - $0.60: A major resistance zone, where strong selling pressure could emerge.
Is Now a Good Time to Buy IOTA?
The recent breakout from support and bullish RSI movement suggest that IOTA could be entering a new uptrend. However, traders should watch key resistance levels before expecting a full recovery to previous highs.
For long-term investors, accumulating near $0.20-$0.22 could be a strong opportunity, given that IOTA has historically rebounded from these levels. On the other hand, short-term traders should focus on breakouts above $0.30 for confirmation of further bullish momentum.
--> Click here to easily trade IOTA today <--
Disclaimer: The content of this article solely reflects the author's opinion and does not represent the platform in any capacity. This article is not intended to serve as a reference for making investment decisions.
You may also like
U.S. Non-Farm Payrolls Revised Down by 95,000 Jobs


Sui (SUI) Flashes Potential Reversal Setup – Will It Bounce Back?

Pepe (PEPE) To Bounce Back? Key Harmonic Pattern Signals Potential Upside Move