XRP Breaks Below $2.20 Support, Bears Take Control

XRP price has initiated a fresh decline, falling below critical support levels of $2.250 and $2.20. The cryptocurrency is currently consolidating losses while remaining vulnerable to further downward pressure.
The digital asset is now trading below both the $2.220 mark and the 100-hourly Simple Moving Average , indicating a strengthening bearish trend. Technical analysis reveals a key bearish trend line forming with resistance at $2.20 on the hourly chart of the XRP/USD pair, based on data from Kraken.
Analysts suggest the pair may continue its downward trajectory unless it achieves a close above the $2.30 resistance zone.
"The current price action shows multiple bearish indicators," noted one market observer. "XRP is struggling to maintain position above even the 23.6% Fibonacci retracement level of the recent downward movement."
XRP initially failed to sustain momentum above the $2.350 resistance zone before beginning its current decline, mirroring similar movements in Bitcoin . The price subsequently broke below support at $2.25 and $2.20, eventually dipping below the $2.120 level to enter what traders consider a bearish zone.
A low point was established at $2.0220, with the cryptocurrency now fighting to maintain position above the $2.00 psychological barrier. On the upside, analysts identify potential resistance near $2.120, with the first major resistance level positioned at $2.20 or the 50% Fibonacci retracement level of the downward move from the $2.363 swing high to the $2.022 low.
Beyond these levels, additional resistance stands at $2.30. A definitive break above this threshold could potentially propel the price toward $2.350. Further gains might extend to the $2.420 or even $2.450 range in the near term, with the next significant hurdle for bulls positioned at $2.50.
Should XRP fail to overcome the $2.20 resistance zone, another decline could materialize. Initial support appears near the $2.020 level, with the next major support positioned at the psychologically important $2.00 mark. A downside break and close below $2.00 could accelerate the decline toward $1.9650 support, with further potential for movement toward the $1.880 zone.
Technical indicators reinforce the bearish outlook. The hourly MACD for XRP/USD is gaining momentum in the bearish zone, while the hourly Relative Strength Index (RSI) has fallen below the 50 level.
Major support levels to watch include $2.020 and $2.00, while key resistance levels are established at $2.20 and $2.30.
Disclaimer: The content of this article solely reflects the author's opinion and does not represent the platform in any capacity. This article is not intended to serve as a reference for making investment decisions.
You may also like
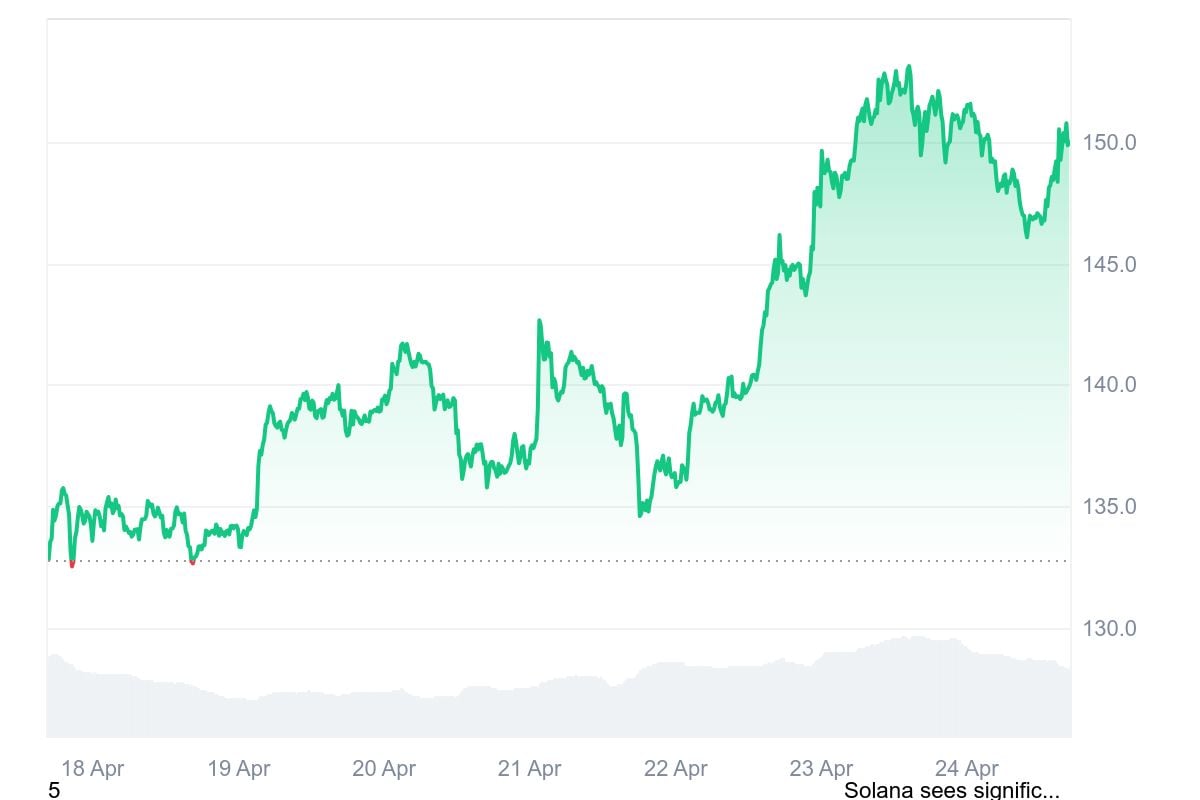
Solana Sell-off Risk Fades as SOL Price Reclaims Key Resistance Level
Tariffs and Bitcoin, what is the connection?
Charles Hoskinson Claims Ethereum May Collapse as Layer 2s Drain Value

Bitcoin Price Breakdown Alert – $78,000 Incoming as Head & Shoulders Pattern Confirmed