Onyxcoin (XCN) Testing Symmetrical Triangle Support: Could a Bounce Lead to a Breakout?

Date: Tue, February 11, 2025 | 07:08 AM GMT
The cryptocurrency market has started the week with a much-needed recovery, with major altcoins turning green after weeks of correction. Bitcoin dominance has declined by 0.72% today to 61.15%, pushing the market for a rebound today.
However, Onyxcoin (XCN) remains in the red, dropping 5% today and marking a 22% correction over the last seven days. This comes after an explosive rally witnessed in the past month.
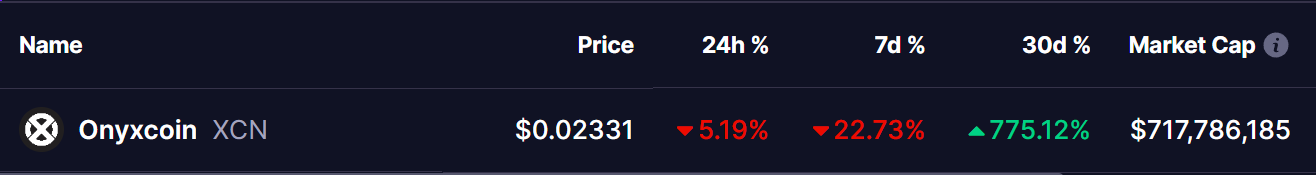 Source: Coinmarketcap
Testing the Symmetrical Triangle’s Support
XCN saw an impressive surge last month, skyrocketing by over 1500% and reaching a peak of $0.049 on January 26. This rapid rise was followed by a correction, forming a Symmetrical Triangle pattern, which typically signals either continuation or reversal depending on the breakout direction.
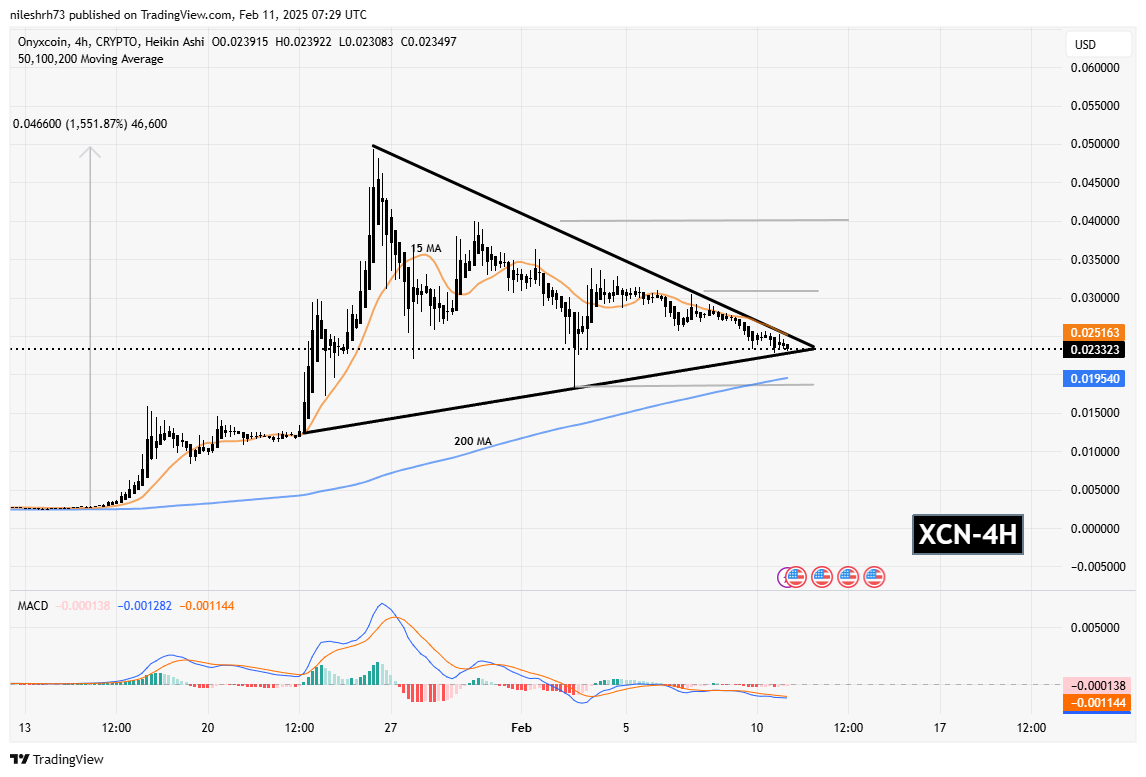 Onyxcoin (XCN) 4H Chart/Coinsprobe (Source: Tradingview)
Currently, XCN is testing the lower support trendline of the triangle at $0.022, a level that previously triggered a rebound and currently trdaing near it at $0.023,. If the price holds and bounces from here, it could approach the 15-day MA and the upper resistance of the triangle, attempting a breakout. A successful breakout with a retest could ignite fresh upside momentum, targeting the next resistance levels at $0.027 and $0.040.
However, if XCN fails to hold this key support, it could decline toward the next downside support at $0.01862, aligning with the 200 MA.
The MACD (Moving Average Convergence Divergence) indicator is currently showing a bearish crossover, signaling weakening momentum. However, if buying pressure increases at this support level, the MACD could turn bullish, confirming a potential reversal.
Final Thoughts
XCN is at a decisive moment, testing a crucial support level within the symmetrical triangle. A bounce could lead to a breakout and a fresh rally, while failure to hold could result in further downside. Traders should watch the support at $0.022, the 15-day MA, and the MACD indicator closely to determine the next move.
Disclaimer: This article is for informational purposes only and not financial advice. Always conduct your own research before investing in cryptocurrencies.
Disclaimer: The content of this article solely reflects the author's opinion and does not represent the platform in any capacity. This article is not intended to serve as a reference for making investment decisions.
You may also like
Enjoy daily zero-interest spot margin trading — Trade to win up to 1000 USDT!
NODEUSDT now launched for futures trading and trading bots
HFTUSDT now launched for futures trading and trading bots
FRAGUSDT now launched for futures trading and trading bots