Bitcoin Struggles at $99K as Resistance Holds, Is More Downside Ahead?

Bitcoin struggles to break resistance, staying near $99K with weak rebounds, keeping bearish pressure intact. Further downside targets at $91K and $87K remain in focus as selling pressure persists in the current market structure. A breakout above the descending trendline is crucial for a bullish shift, but resistance levels continue to hold strong.
- Bitcoin struggles to break resistance, staying near $99K with weak rebounds, keeping bearish pressure intact.
- Further downside targets at $91K and $87K remain in focus as selling pressure persists in the current market structure.
- A breakout above the descending trendline is crucial for a bullish shift, but resistance levels continue to hold strong.
Bitcoin’s recent price action shows instability as the cryptocurrency tests key support levels. Despite some short-term rebounds, the market structure remains bearish . Analysts point to Bitcoin’s ongoing struggles to break above the resistance levels within the descending channel. Currently, the cryptocurrency hovers near the $99,030 support region, with further downside targets approaching.
Support Levels Remain Critical for Bitcoin
Bitcoin is facing rejection at multiple resistance zones within a descending channel. The price consistently interacts with the upper blue trendline, which acts as resistance. Rejections have occurred at key levels, including $106,148, which contributed to the downtrend. Moreover, the price continues to test the $101,165 resistance level, which remains a critical barrier.
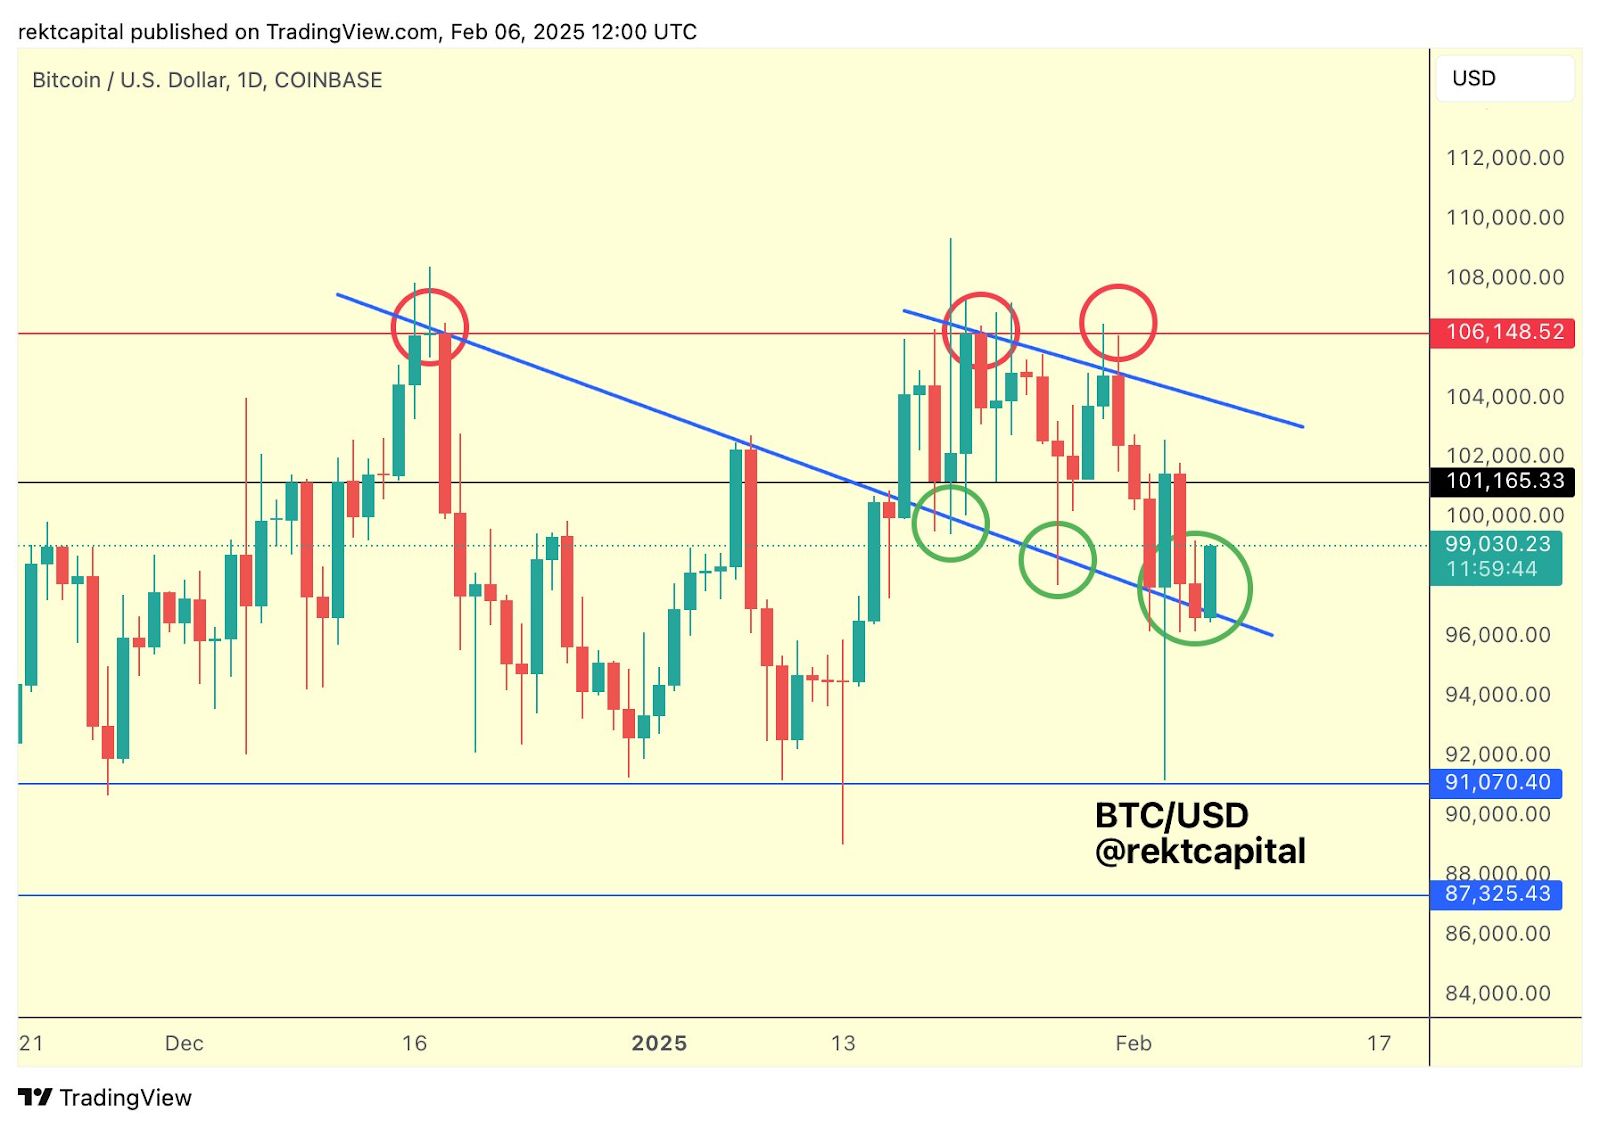 Source: Rext Capital
The $99,030 range has provided temporary support, but Bitcoin has yet to sustain a rebound. Price interactions along this lower boundary show weak bounces. Consequently, the market sentiment remains largely bearish. Bitcoin’s price action forms lower highs and lower lows , reinforcing the downward trend. Therefore, the possibility of further downside movements cannot be dismissed.
Key Downside Targets for Bitcoin
The immediate downside targets for Bitcoin are $91,070 and $87,325. These levels, marked by horizontal blue support lines, could play a crucial role in the selling pressure persists. Should Bitcoin continue to face rejection at resistance, further declines could follow.
Moreover, Bitcoin needs to break above the descending trendline to signal a potential bullish reversal. However, the market structure must first shift before such a breakout can occur. Until then, continued downward pressure seems likely.
Analyst Rekt Capital believes that unless Bitcoin breaks above its current resistance, the cryptocurrency will struggle to escape its bearish trajectory. Therefore, investors should remain cautious as the market waits for a decisive move.
DISCLAIMER: The information on this website is provided as general market commentary and does not constitute investment advice. We encourage you to do your own research before investing.
Disclaimer: The content of this article solely reflects the author's opinion and does not represent the platform in any capacity. This article is not intended to serve as a reference for making investment decisions.
You may also like
Research Report | Tutorial Project Analysis & TUT Market Valuation

Bitcoin price volatility ramps up around FOMC days — Will this time be different?
Bitcoin traders tend to cut risk leading into FOMC meetings, but key price metrics are showing a divergence. Will BTC rally when the Fed minutes are released?

EOS rebrands to Vaulta for $4.1B Web3 banking push

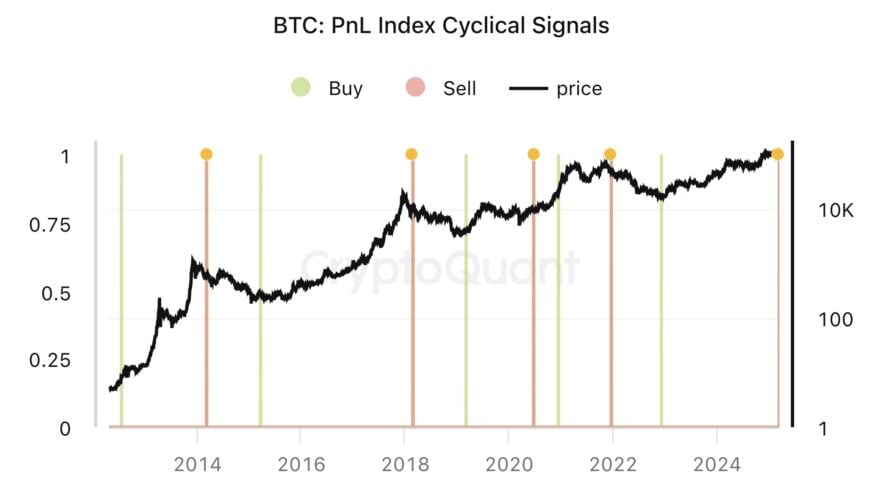
Bitcoin Bull Cycle Over? CryptoQuant CEO Warns of Possible Bearish Trend