BTC price gained 40% in 2 months when Bitcoin was last this rangebound

From cointelegraph by William Suberg
BTC$101,464volatility is repeating the 2023 BTC price breakout as $100,000 remains a magnet.
In one of its latest X posts on Jan. 23, onchain analytics platform Glassnode flagged BTC/USD acting in a “very narrow” range.
BTC price range channels October 2023
Bitcoin bulls have not left $100,000 behind as the round-number level forms an enduring market focus.
BTC/USD has spent more than two months ranging between $90,000 and $110,000 — behavior which is becoming unusual in itself, Glassnode says.
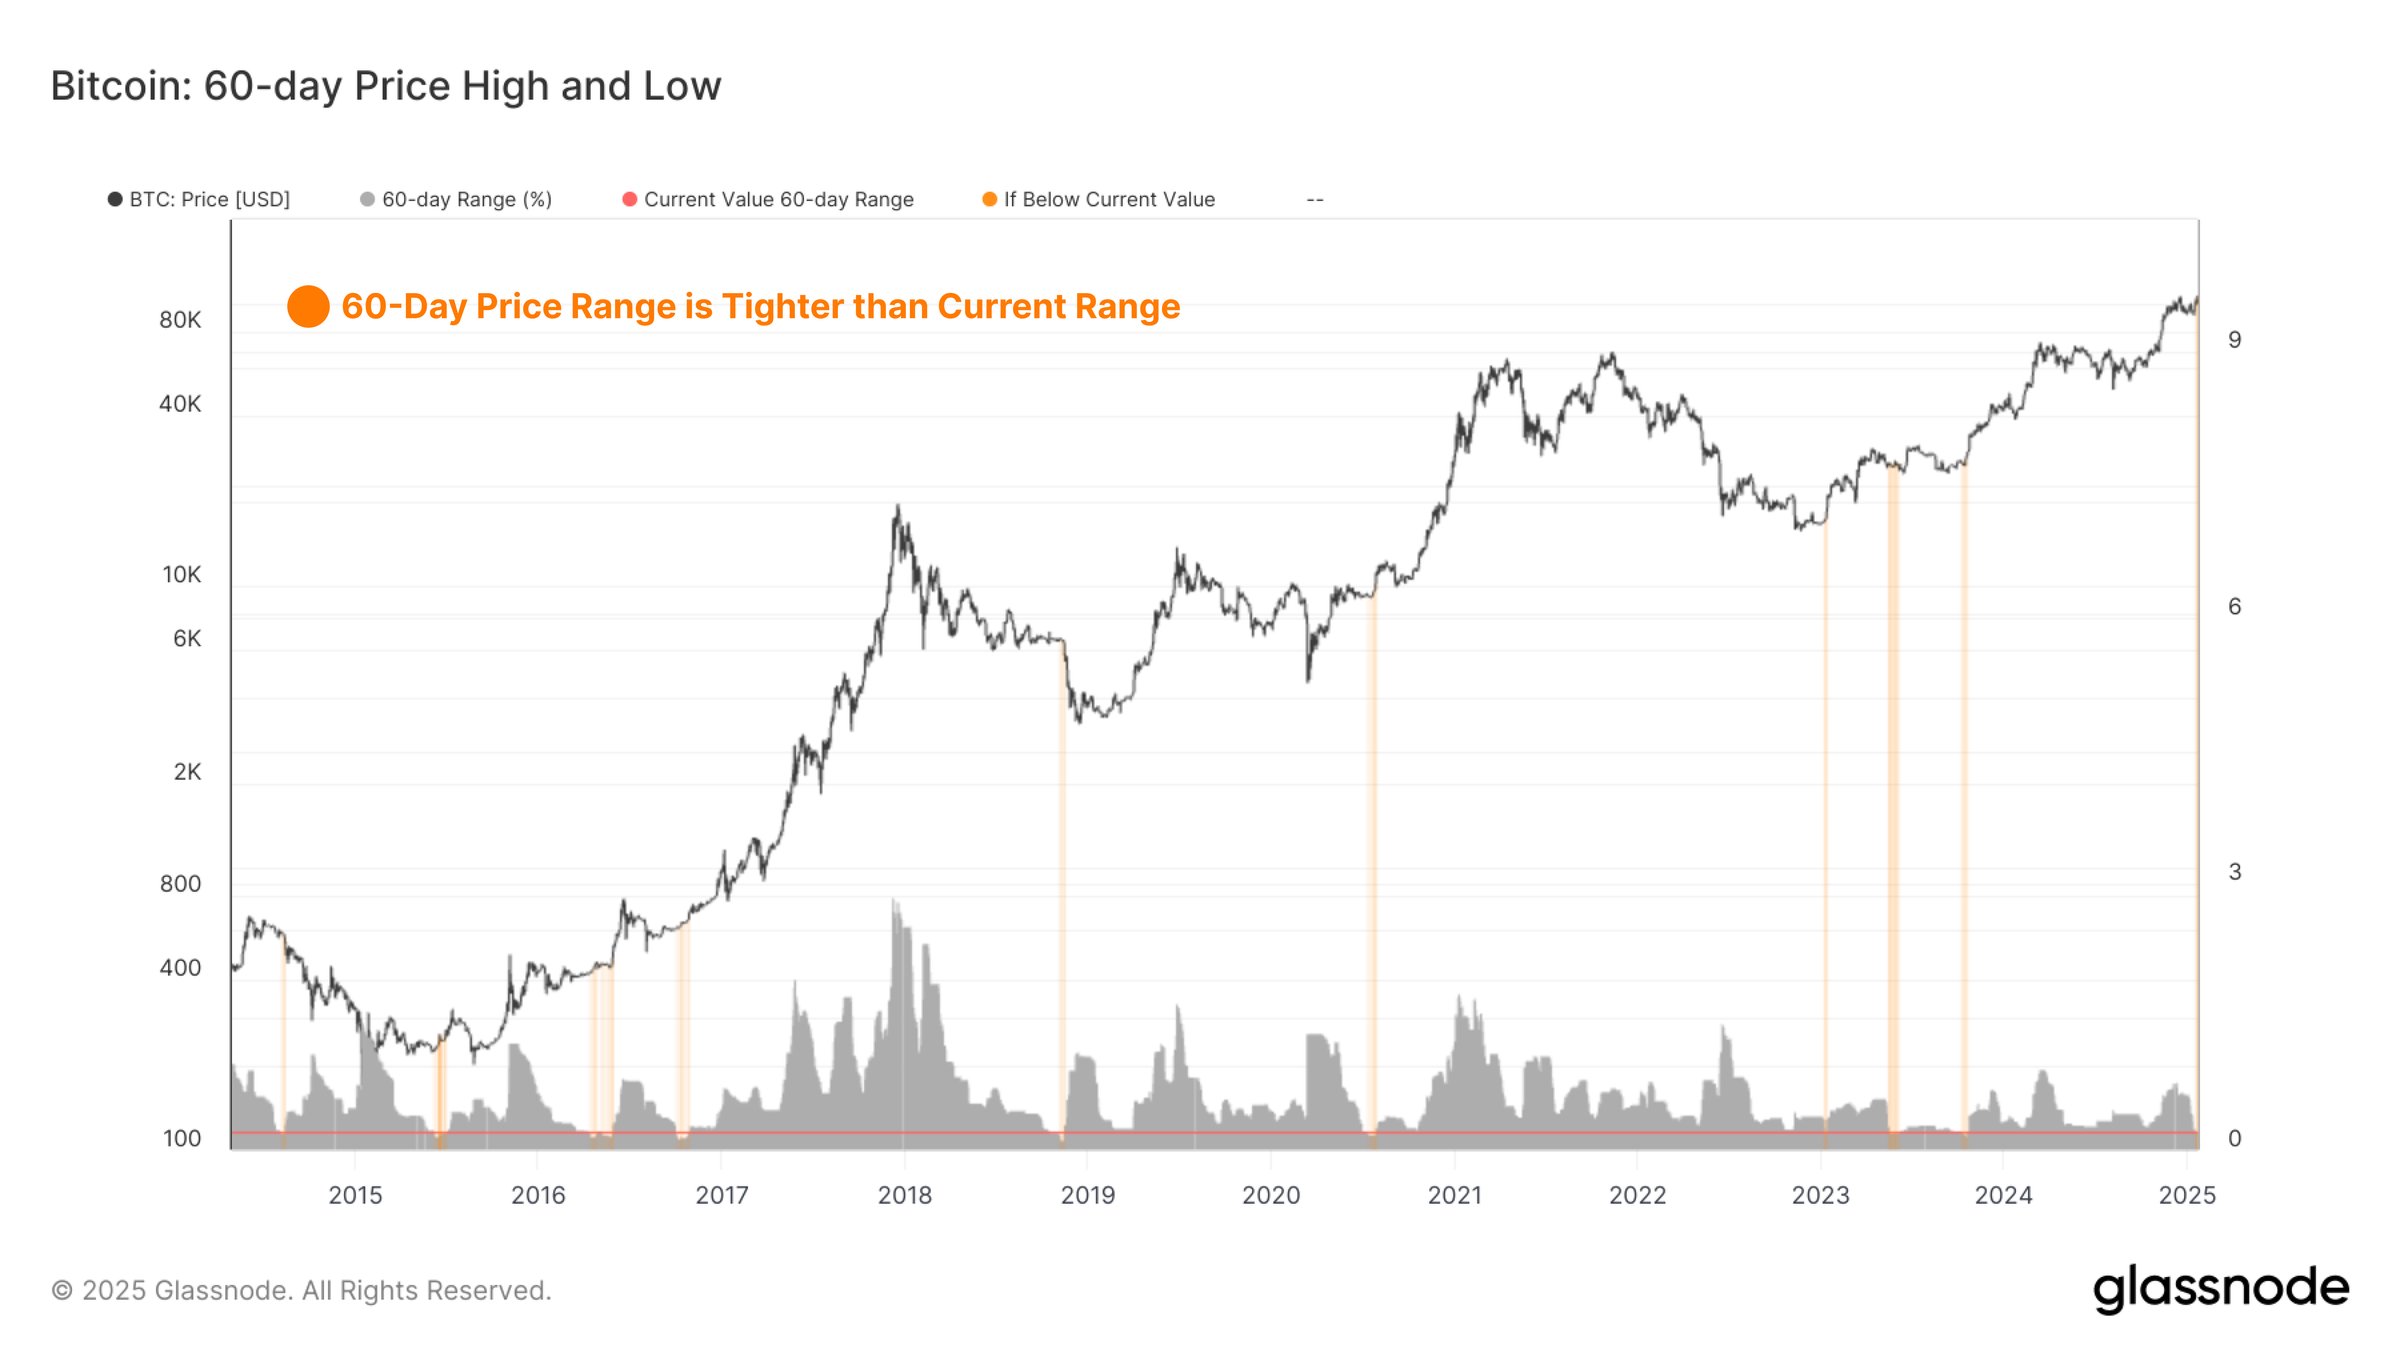
Analyzing 60-day BTC price ranges, researchers showed that the last time mid-term price variety was so constricted was in October 2023.
“Bitcoin’s current 60-day price range is very narrow. Historically, periods of tight price ranges often preceded heightened volatility,” they commented.
 BTC/USD 60-day range data. Source: Glassnode/X
The current 60-day range is 19% — a level seen only five times since 2019 and which in 2023 came at the start of major BTC price upside.
From around $30,000 on Oct. 22 that year, BTC/USD expanded to $42,000 by Dec. 31 — a 40% increase in around two months.
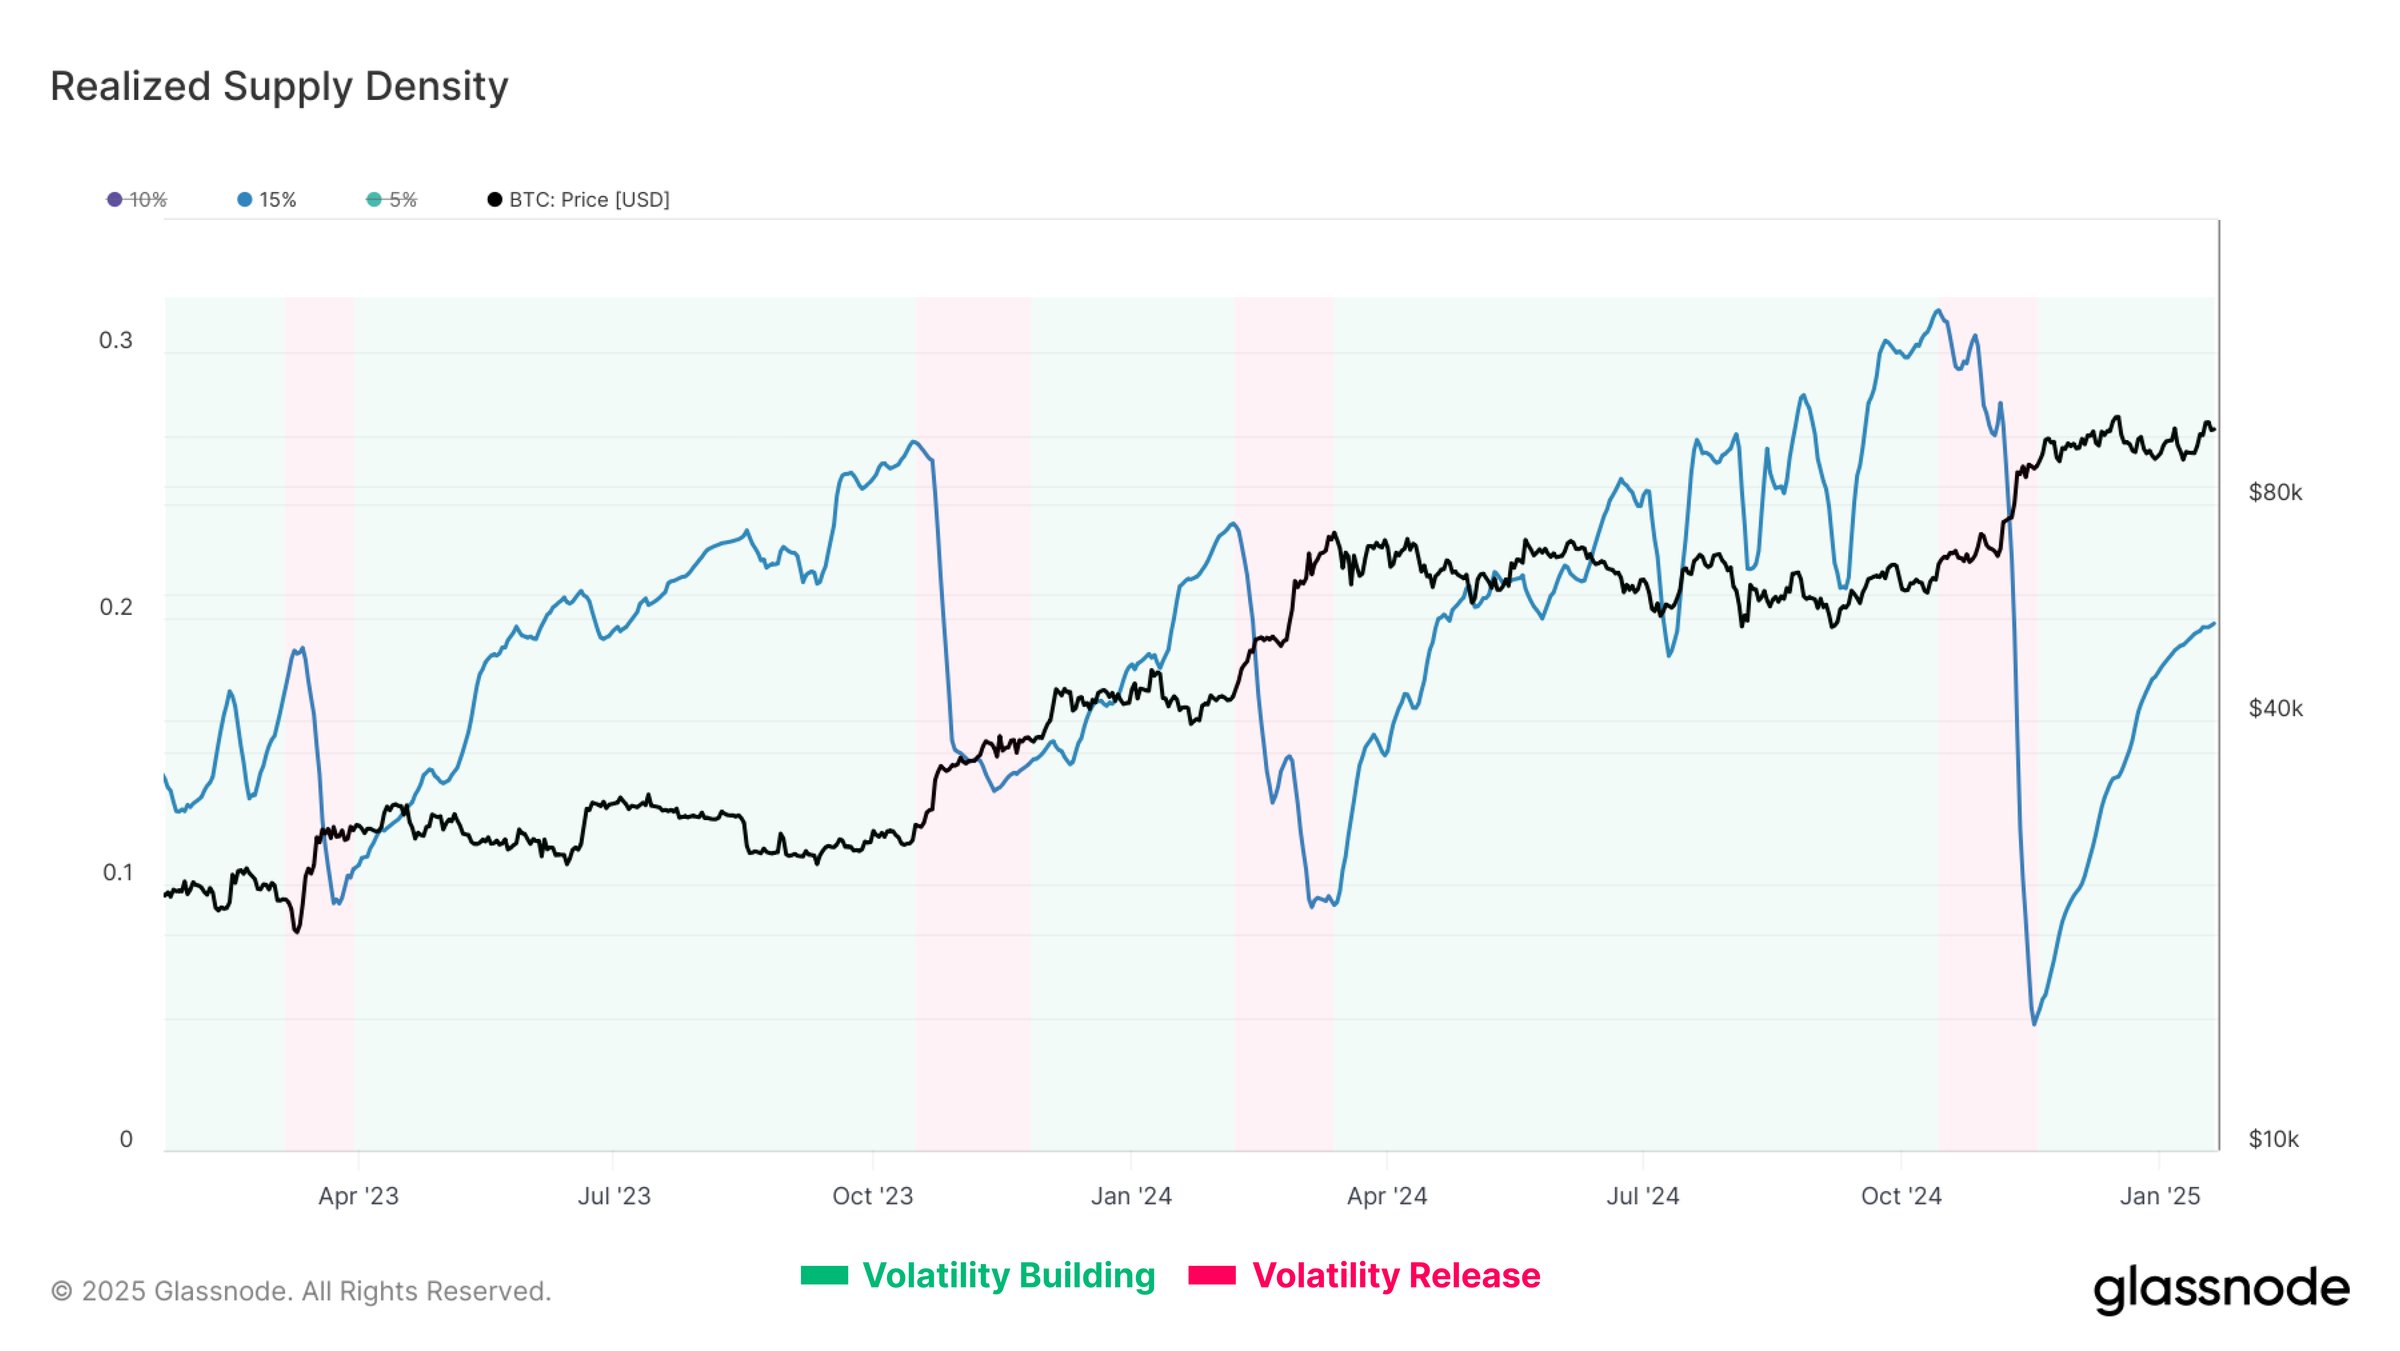
“Furthermore, 20% of $BTC supply is concentrated within ±15% of the spot price,” Glassnode continued, referring to prices at which the BTC supply last moved.
“This creates the potential for amplified market volatility as investor profitability shifts.”
 Bitcoin realized supply density. Source: Glassnode/X
Glassnode previously discussed the price range data in the latest edition of its regular newsletter, “ The Week Onchain ,” released on Jan. 21.
“When supply is highly concentrated around the spot price, small movements in price can significantly affect investor profitability, which in turn can amplify market volatility,” it confirmed.
“After the Bitcoin price peaked in December, it started to consolidate, creating a dense concentration of supply with a cost basis close to the spot price.”
Bollinger Bands deliver classic breakout hints
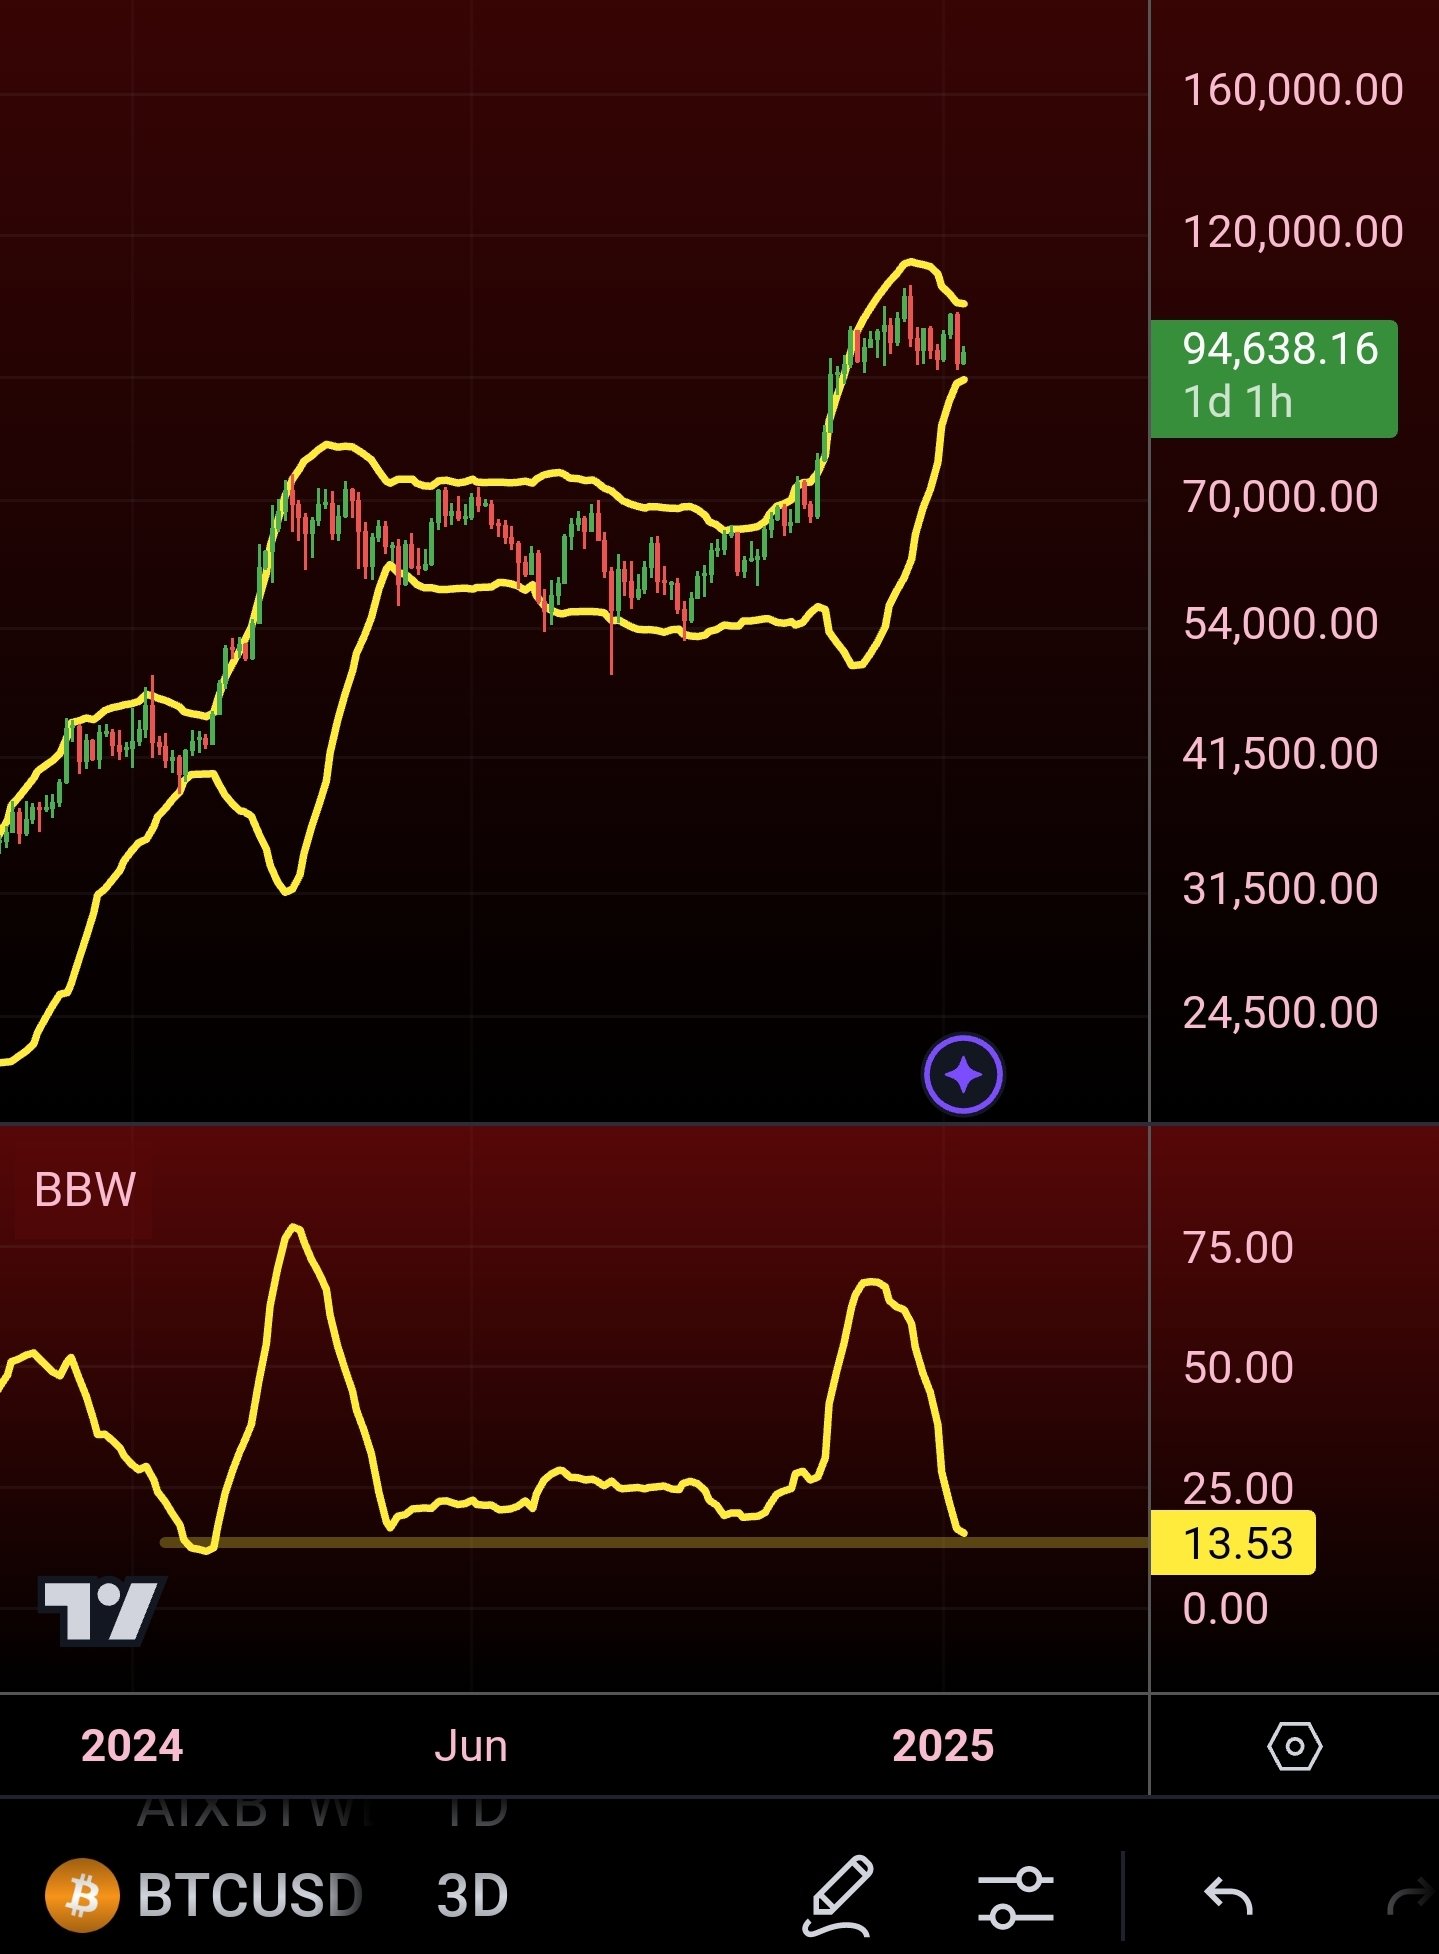
Despite short-term snap moves within the range, BTC price volatility is historically low, as viewed through the popular Bollinger Bands indicator.
Related: Watch these Bitcoin price levels next with 'door open' to $100K retest
As noted by trader and analyst Matthew Hyland earlier this month, on 3-day timeframes, the Bands were recently at their closest together since January 2024.
 BTC/USD 3-day chart with Bollinger Bands data. Source: Matthew Hyland/X
In December, the indicator’s creator, John Bollinger, highlighted textbook Bollinger Band behavior from the BTC/USD daily chart.
Disclaimer: The content of this article solely reflects the author's opinion and does not represent the platform in any capacity. This article is not intended to serve as a reference for making investment decisions.
You may also like
Amir Bandeali Stays True to Code as Co-CEO of 0x

Bitcoin Hash Rate Reaches Record High
Bitcoin's hash rate just hit a new all-time high, signaling strong network security and growing miner confidence.What the Record Hash Rate Really MeansA Surge Driven by Miner OptimismPre-Halving Momentum Builds

Bitcoin Nears $85K Amid Trade Optimism and Fed Hints at Rate Cuts
Trade wars push blockchain into supply chain solutions