Hedera’s $4 Million Inflows Ignite Rally Speculation Amid Mixed Market Signals

Hedera Hashgraph’s HBAR records $4M spot inflows, sparking investor optimism. Despite demand growth, bearish momentum challenges price recovery.
HBAR, the native token powering the Hedera Hashgraph distributed ledger, has recorded its first spot inflows in the past week, totaling $4 million. This has sparked speculation that this could mean the altcoin is poised to break above the narrow range it has traded within since early December.
However, bearish pressure persists, putting HBAR’s price at risk of remaining rangebound or even witnessing a drop.
Hedera Records Spot Inflows, But There Is a Catch
According to Coinglass, HBAR’s spot inflows have reached $4 million on Friday. This comes after six consecutive days of fund outflows totaling $26 million.
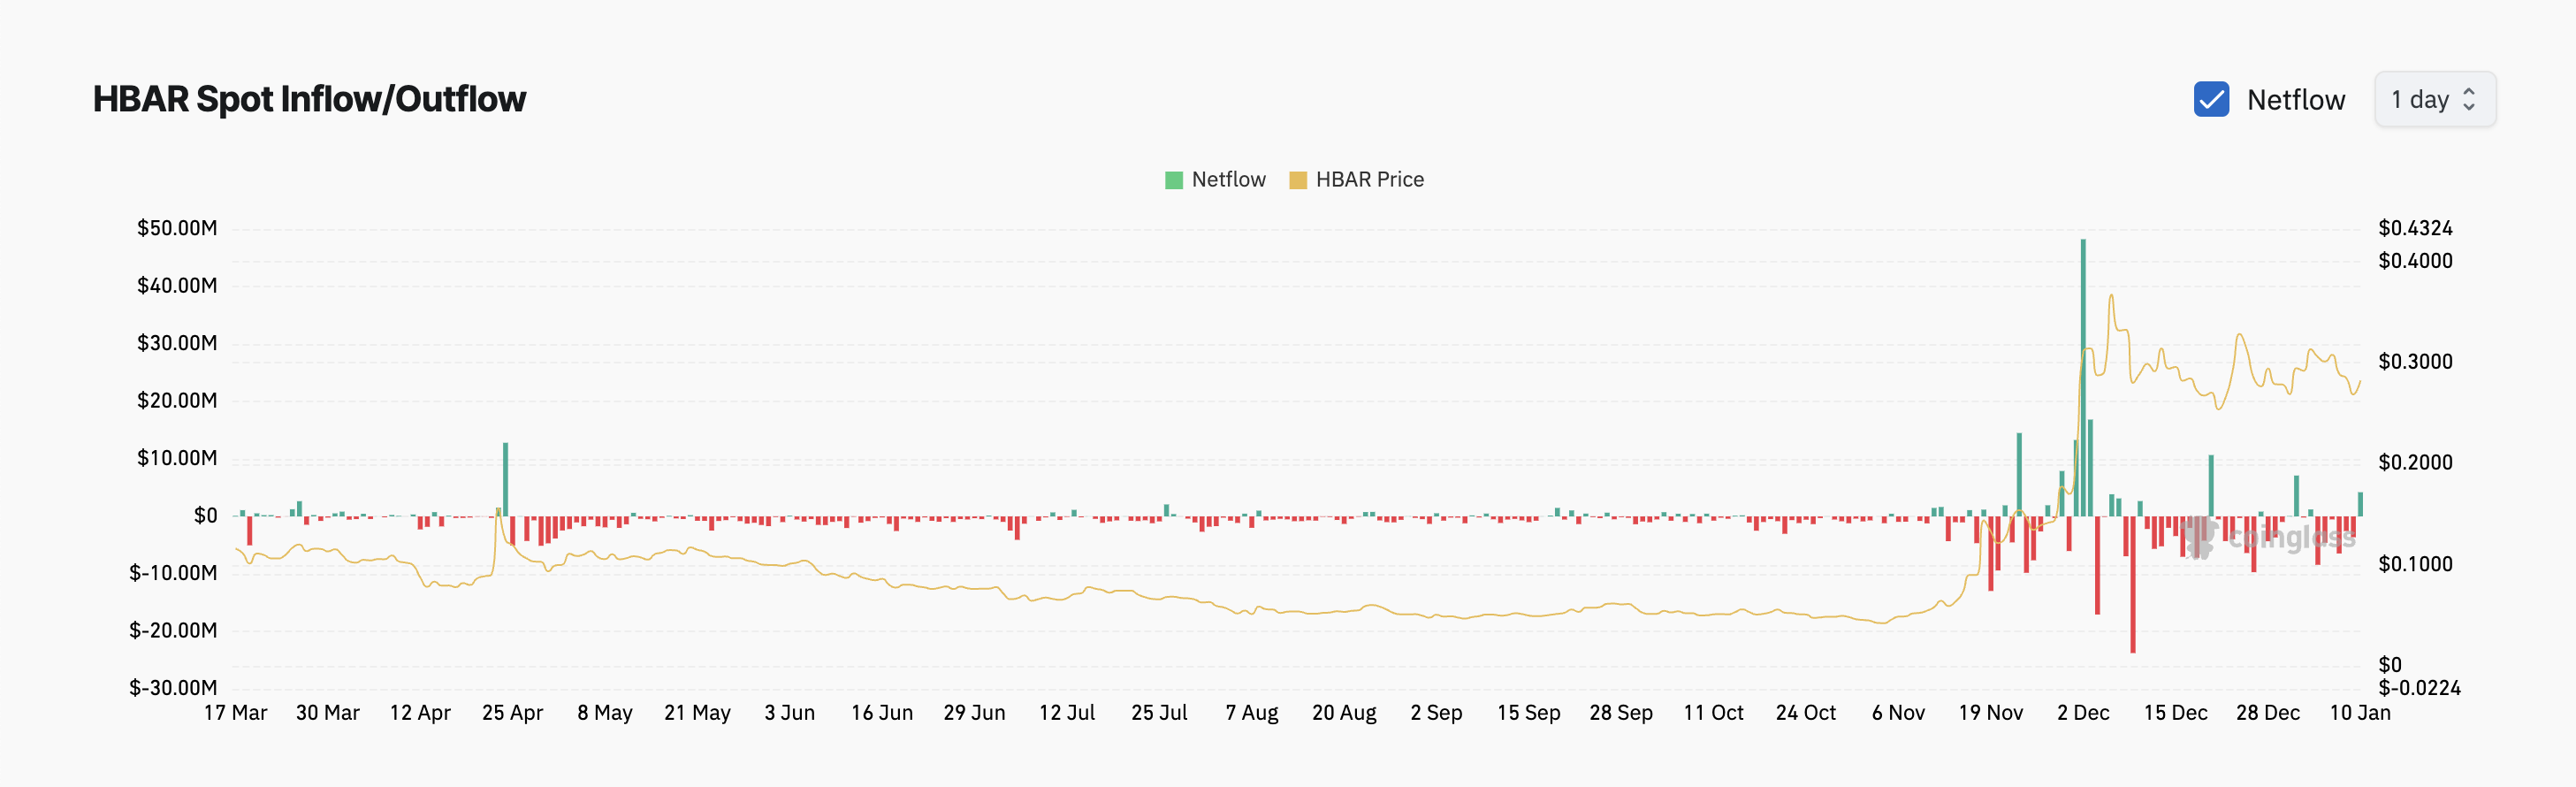 HBAR Spot Inflow/Outflow. Source:
Coinglass
HBAR Spot Inflow/Outflow. Source:
Coinglass
When an asset experiences spot inflows, it means that there is an increase in the purchase of that asset in the spot market, where transactions are settled immediately. This indicates a rise in demand for the asset, as buyers are willing to acquire it at the current market price.
However, while HBAR’s spot inflow is a positive sign, its technical indicators suggest that bearish pressure remains. For example, readings from its True Strength Index (TSI) indicator show the TSI line (blue) below the signal line (red) at press time, reflecting the strengthening bearish bias.
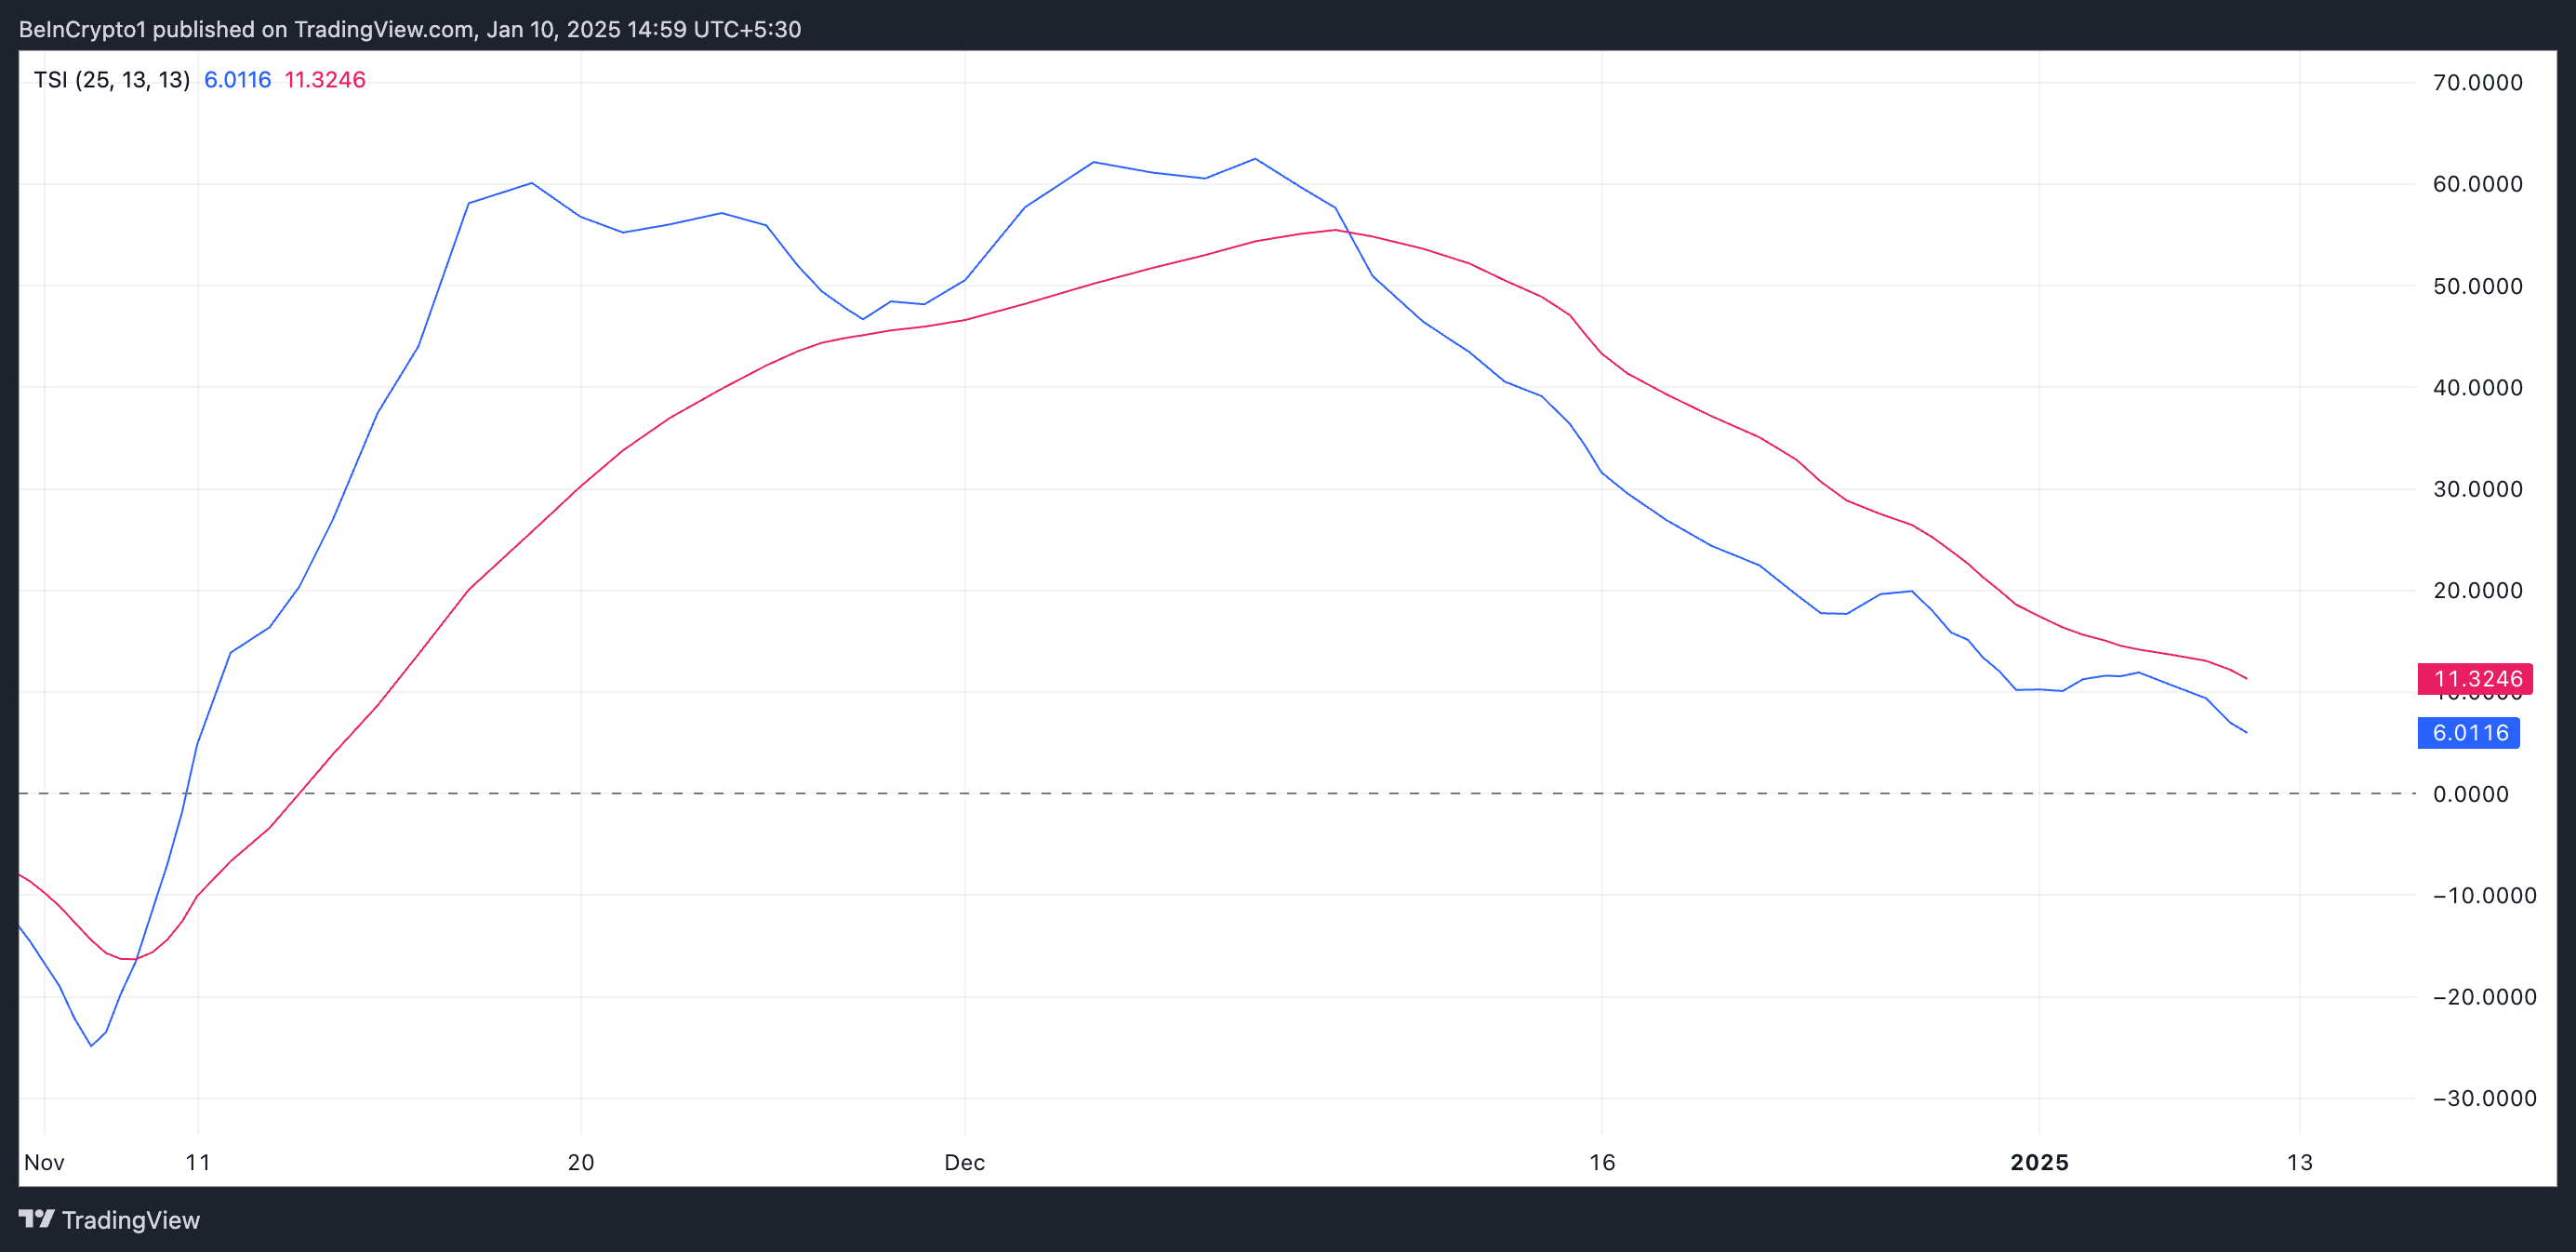 HBAR TSI. Source:
TradingView
HBAR TSI. Source:
TradingView
The TSI indicator helps identify the strength and direction of a trend by smoothing price movements. When the TSI line is below the signal line, it indicates bearish momentum. This suggests that selling pressure is stronger than buying interest.
Moreso, traders interpret this crossover as a sell signal or a warning that the upward trend is weakening and that further downward movement might be ahead.
HBAR’s Moving Average Convergence Divergence (MACD) indicator also supports this bearish outlook. At press time, the token’s MACD line (blue) rests below its signal line (orange).
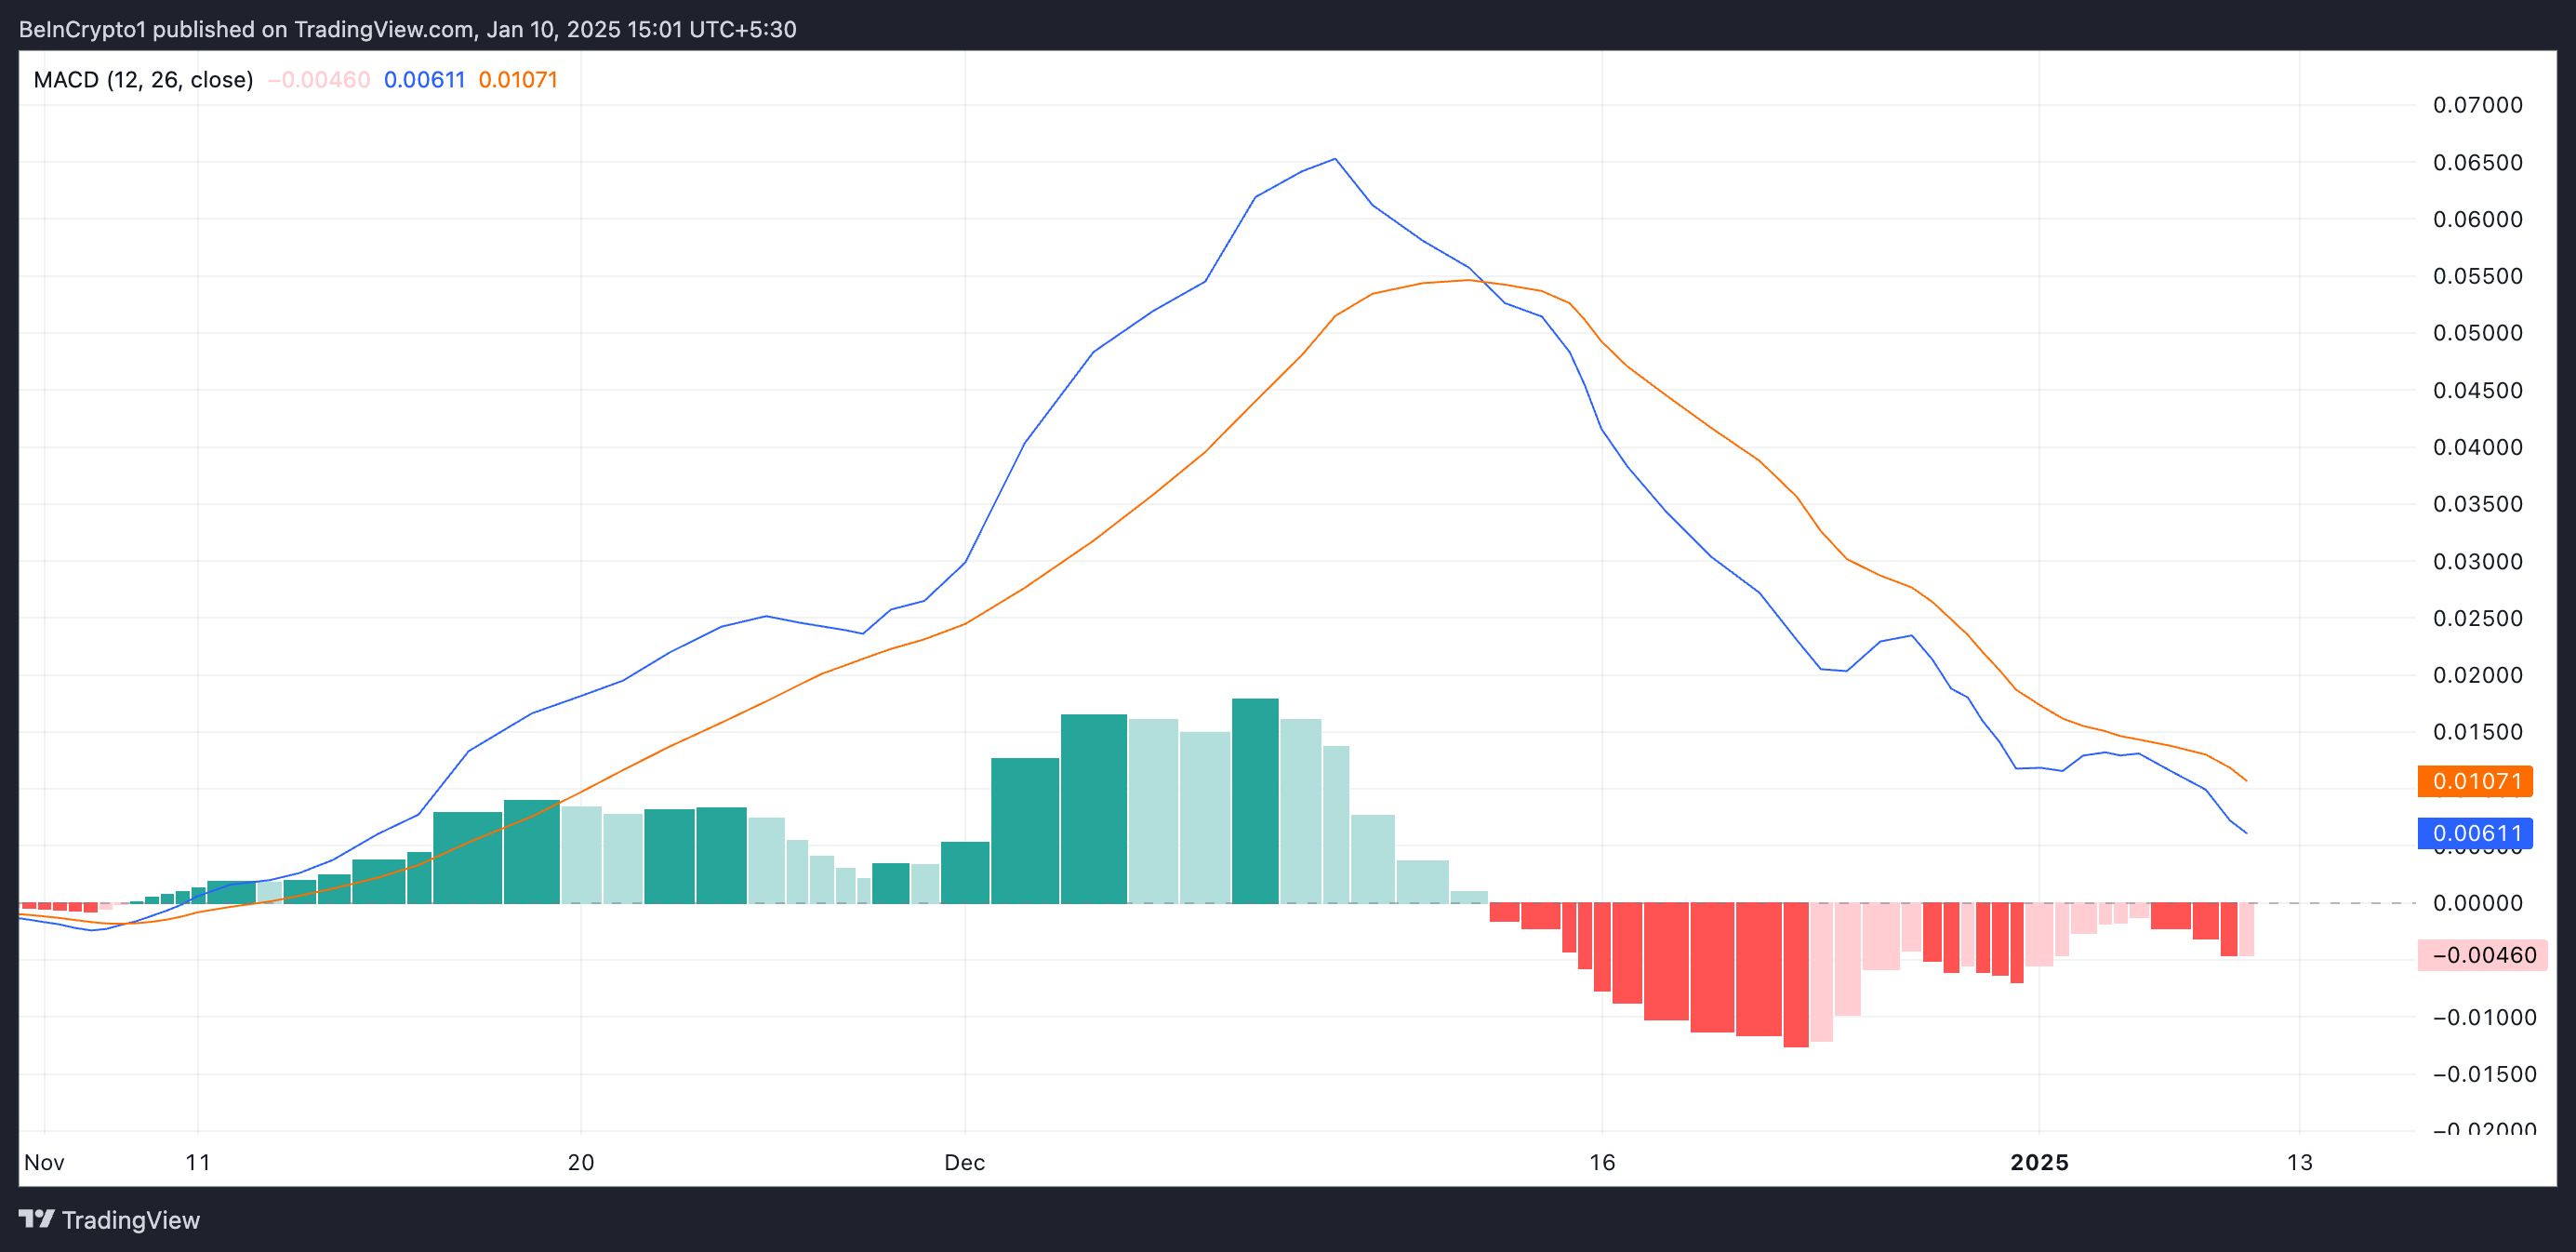 HBAR MACD. Source:
TradingView
HBAR MACD. Source:
TradingView
When this indicator is set up this way, it indicates bearish momentum. This means that selloffs exceed buying activity among market participants, putting significant downward pressure on its price.
HBAR Price Prediction: Time to Break Out of This Range?
Since December 4, HBAR’s price has oscillated between a price range. It has faced resistance at $0.33 and found support at $0.24. As of this writing, the altcoin trades just above this support level at $0.28.
With the increasing downward pressure on its price, it may fall to test this support. Should it fail to hold, its value could plunge further to $0.16.
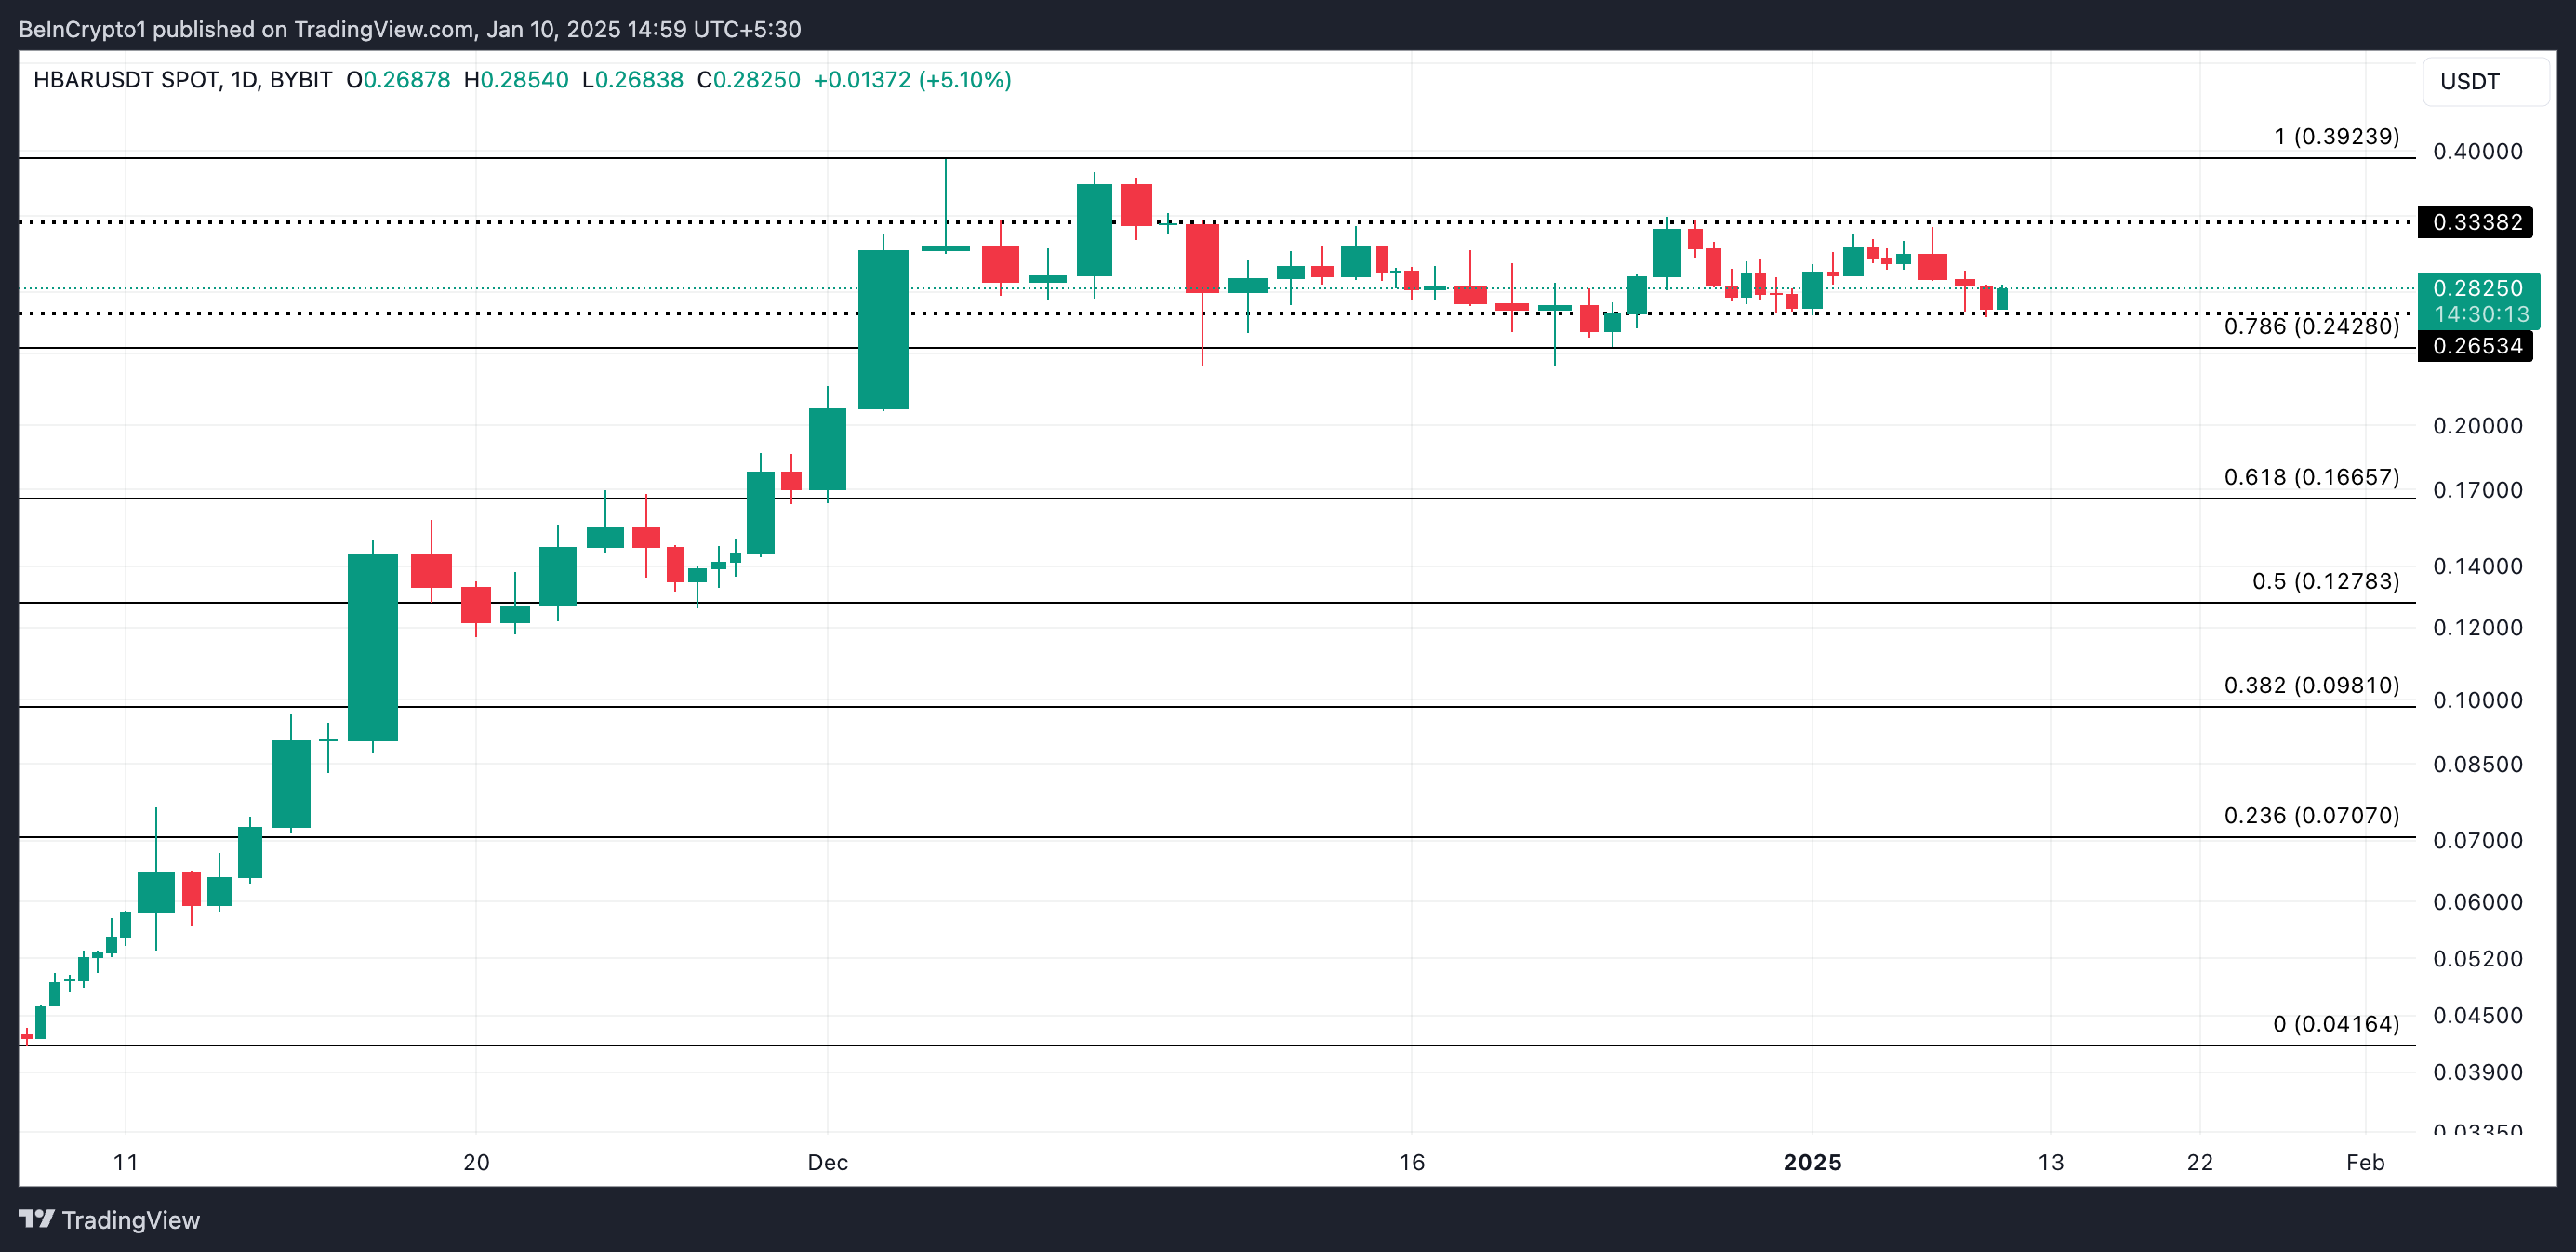 HBAR price Analysis. Source:
TradingView
HBAR price Analysis. Source:
TradingView
Conversely, if inflows into the token’s spot market continue due to sustained demand for the altcoin, HBAR’s price could rise to $0.33.
Disclaimer: The content of this article solely reflects the author's opinion and does not represent the platform in any capacity. This article is not intended to serve as a reference for making investment decisions.
You may also like
Popcat Surges 105% in Solana’s Memecoin Revival

Sweat Economy Unveils AI Agents for Move-to-Earn Platform

Sei Blockchain Proposes Shift to EVM-Based System

New bull cycle? Bitcoin's return to $100K hints at ‘significant price move’