HBAR Bull Flag Formation Looks to Erase Losses, Get Bullish Momentum Back on Track
Hedera (HBAR) is showing bullish signs despite recent losses, with a bull flag setup suggesting potential price growth towards $0.40
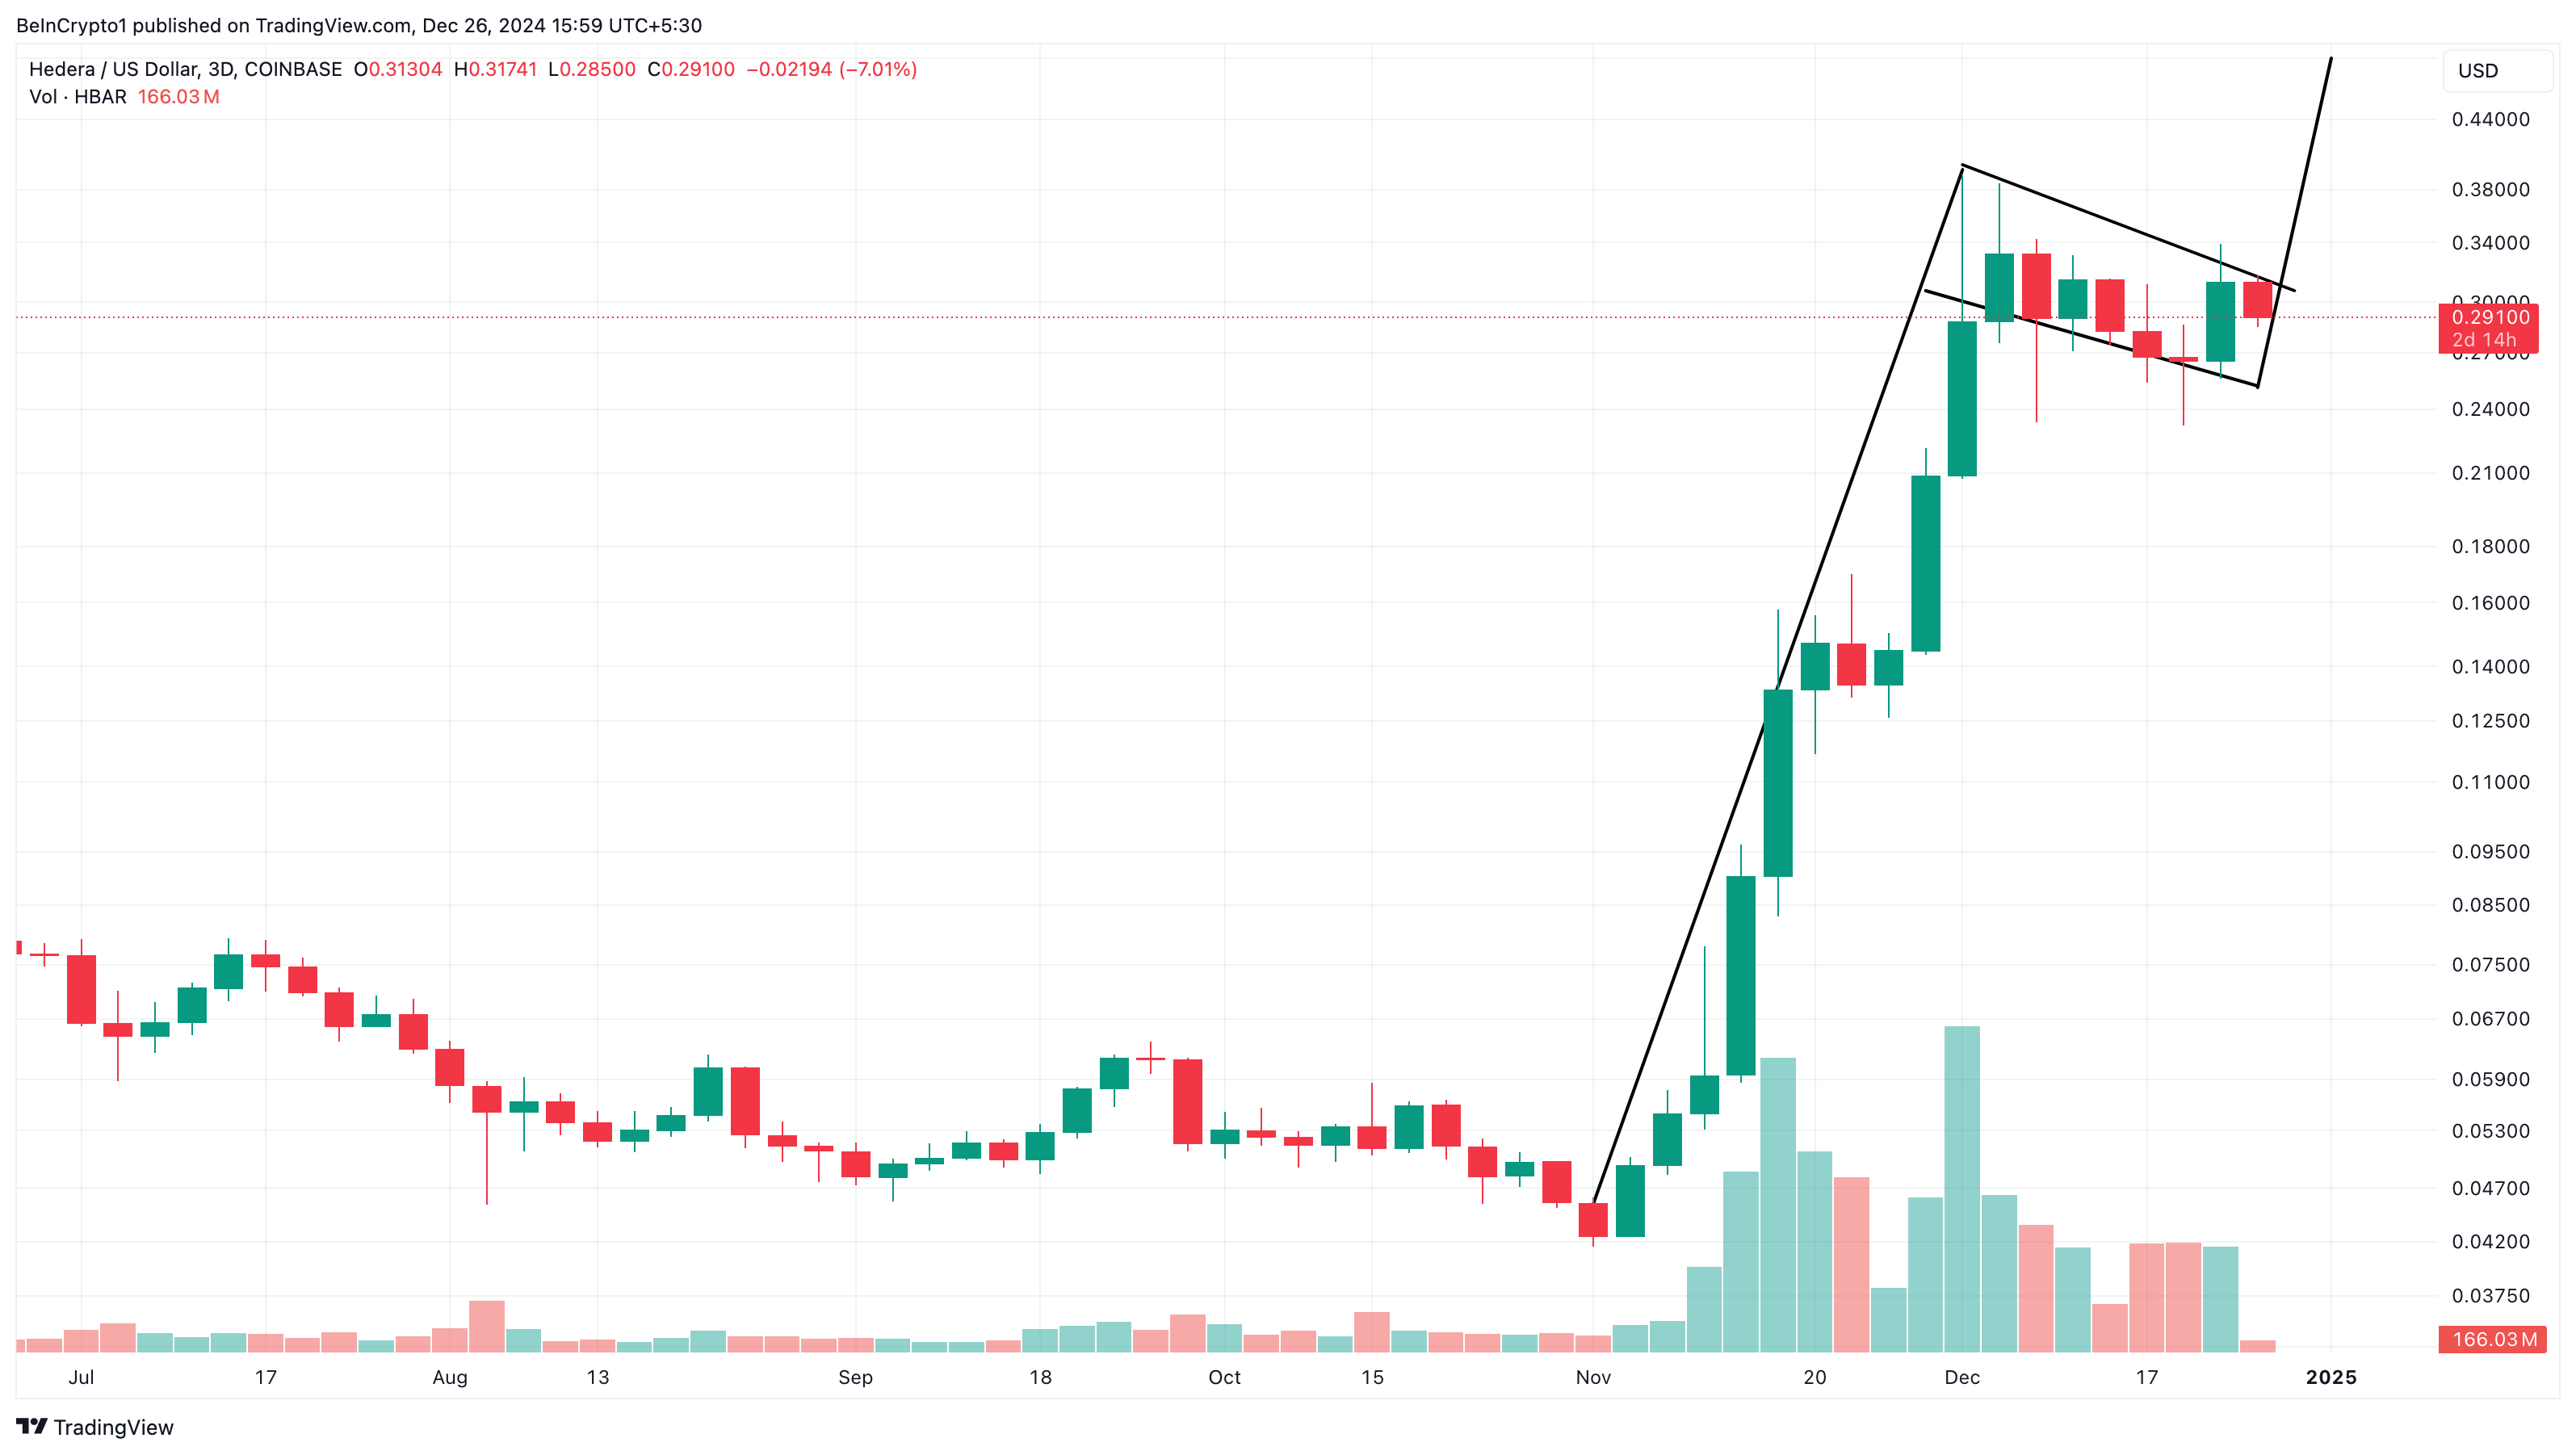
Despite experiencing a 10% pullback in the last 24 hours, the Hedera (HBAR) price has the potential to erase this loss. This assertion is because of the HBAR bull flag formation, which suggests that the decline to $0.29 may not last.
Besides the technical pattern, other factors also indicate that a significant rally could be in the works.
Hedera Eyes Breakout as Traders Bet on Recovery
On Christmas Day, HBAR’s price was $0.32, but at the time of writing, the altcoin’s value has tanked to $0.29. This decline could be attributed to rising selling pressure and the lack of notable buying pressure in the market.
However, HBAR’s price action on the 3-day timeframe shows that it has formed a bull flag. The bull flag pattern resembles a flag on a pole and is considered a bullish pattern. It typically forms after a strong upward price movement, followed by a brief consolidation or pullback.
When validated, this pattern is viewed as a continuation of the uptrend. With the HBAR bull flag formation, the altcoin’s price is likely to experience a significant rally toward $0.40.
 Hedera 3-Day Analysis. Source:
TradingView
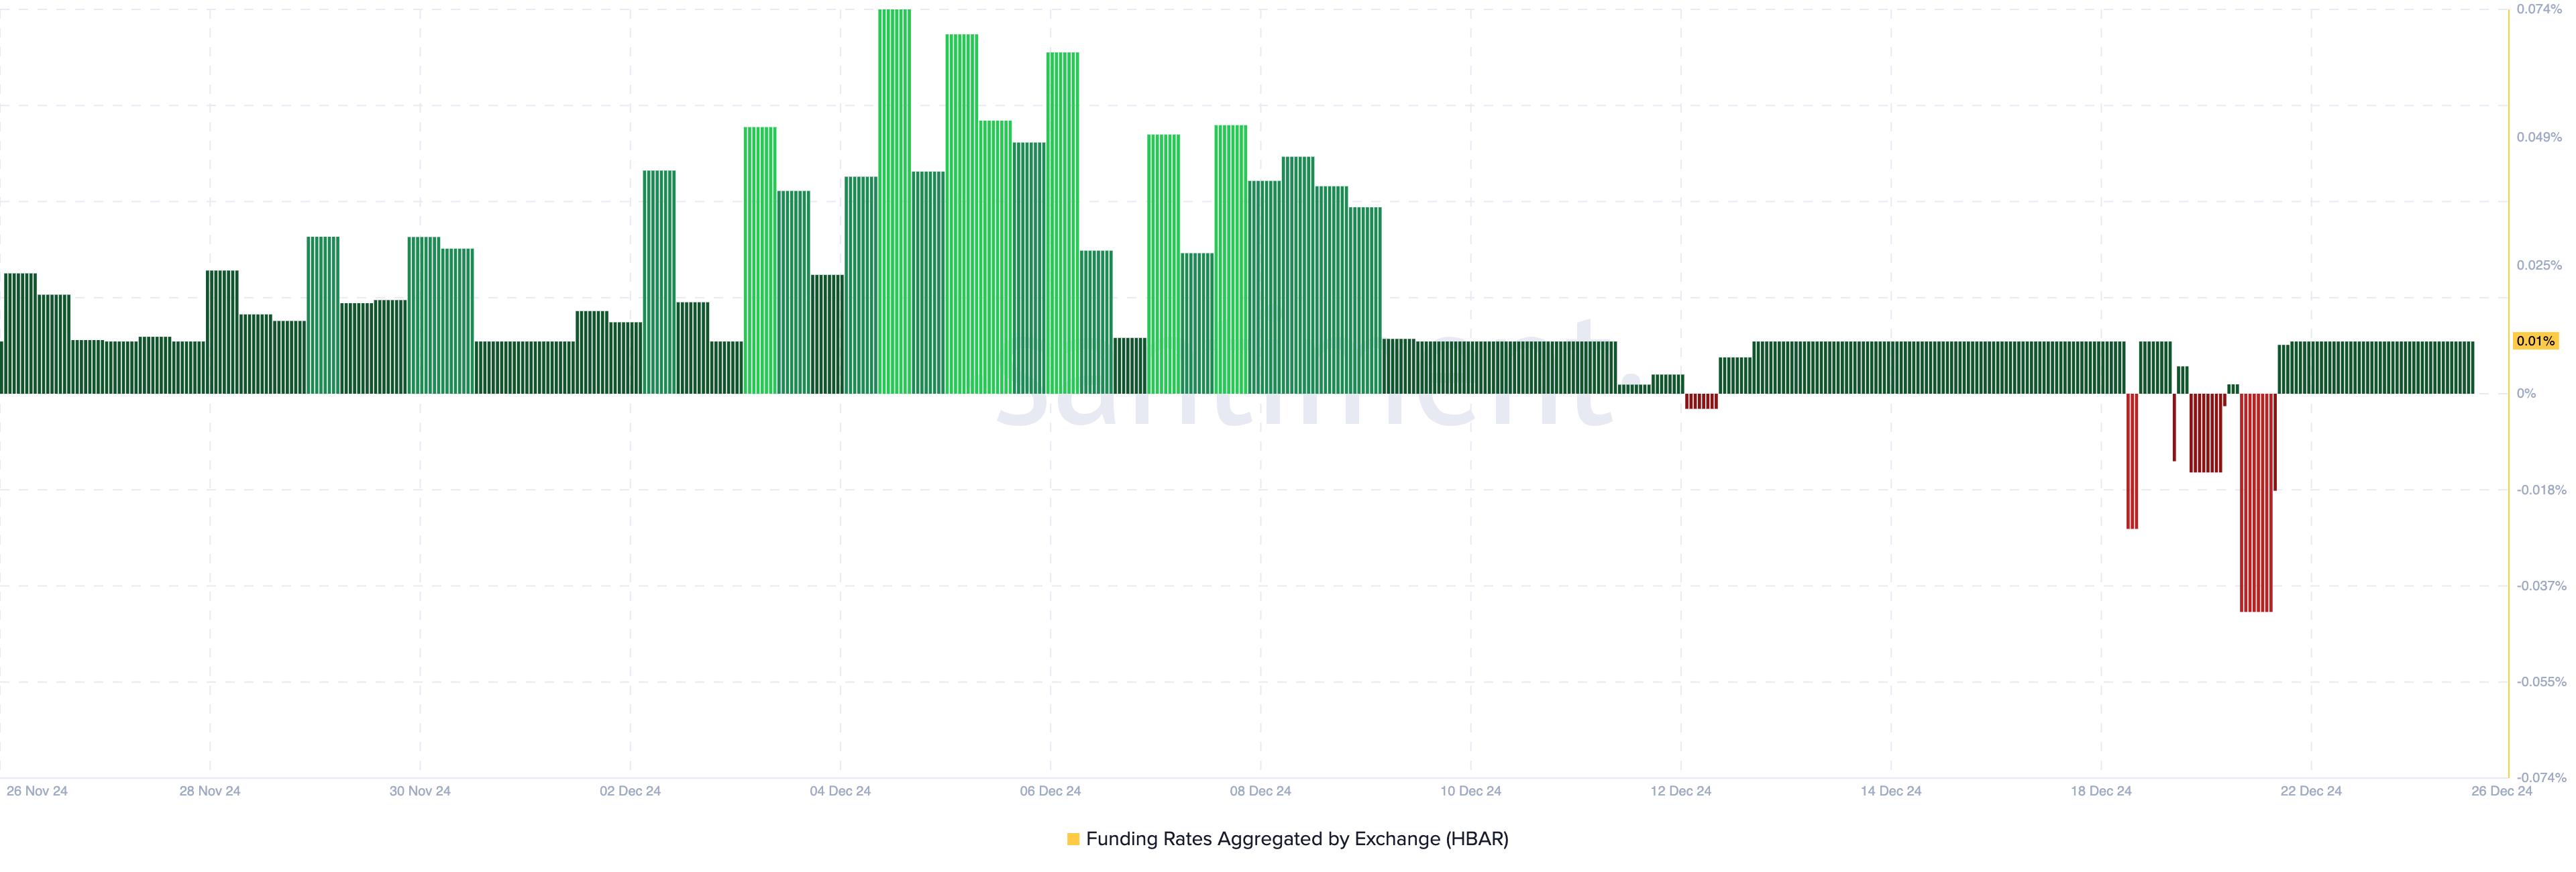
It also appears that traders are expecting the cryptocurrency’s value to rise, as indicated by the funding rate. The funding rate represents the cost of holding an open position in a perpetual contract.
When the funding rate is positive, the perpetual price trades at a premium (above) the spot price, and open long positions pay a funding fee while open short positions receive it. Conversely, when the funding rate is negative, the perpetual price trades at a discount (below) to the index price.
According to Santiment Hedera, its funding rate is in the positive region at 0.01%. If sustained, the dominant open long positions could fuel HBAR’s price to move higher in the short term.
 Hedera Funding Rate. Source:
Santiment
HBAR Price Prediction: Move to $0.40 Likely
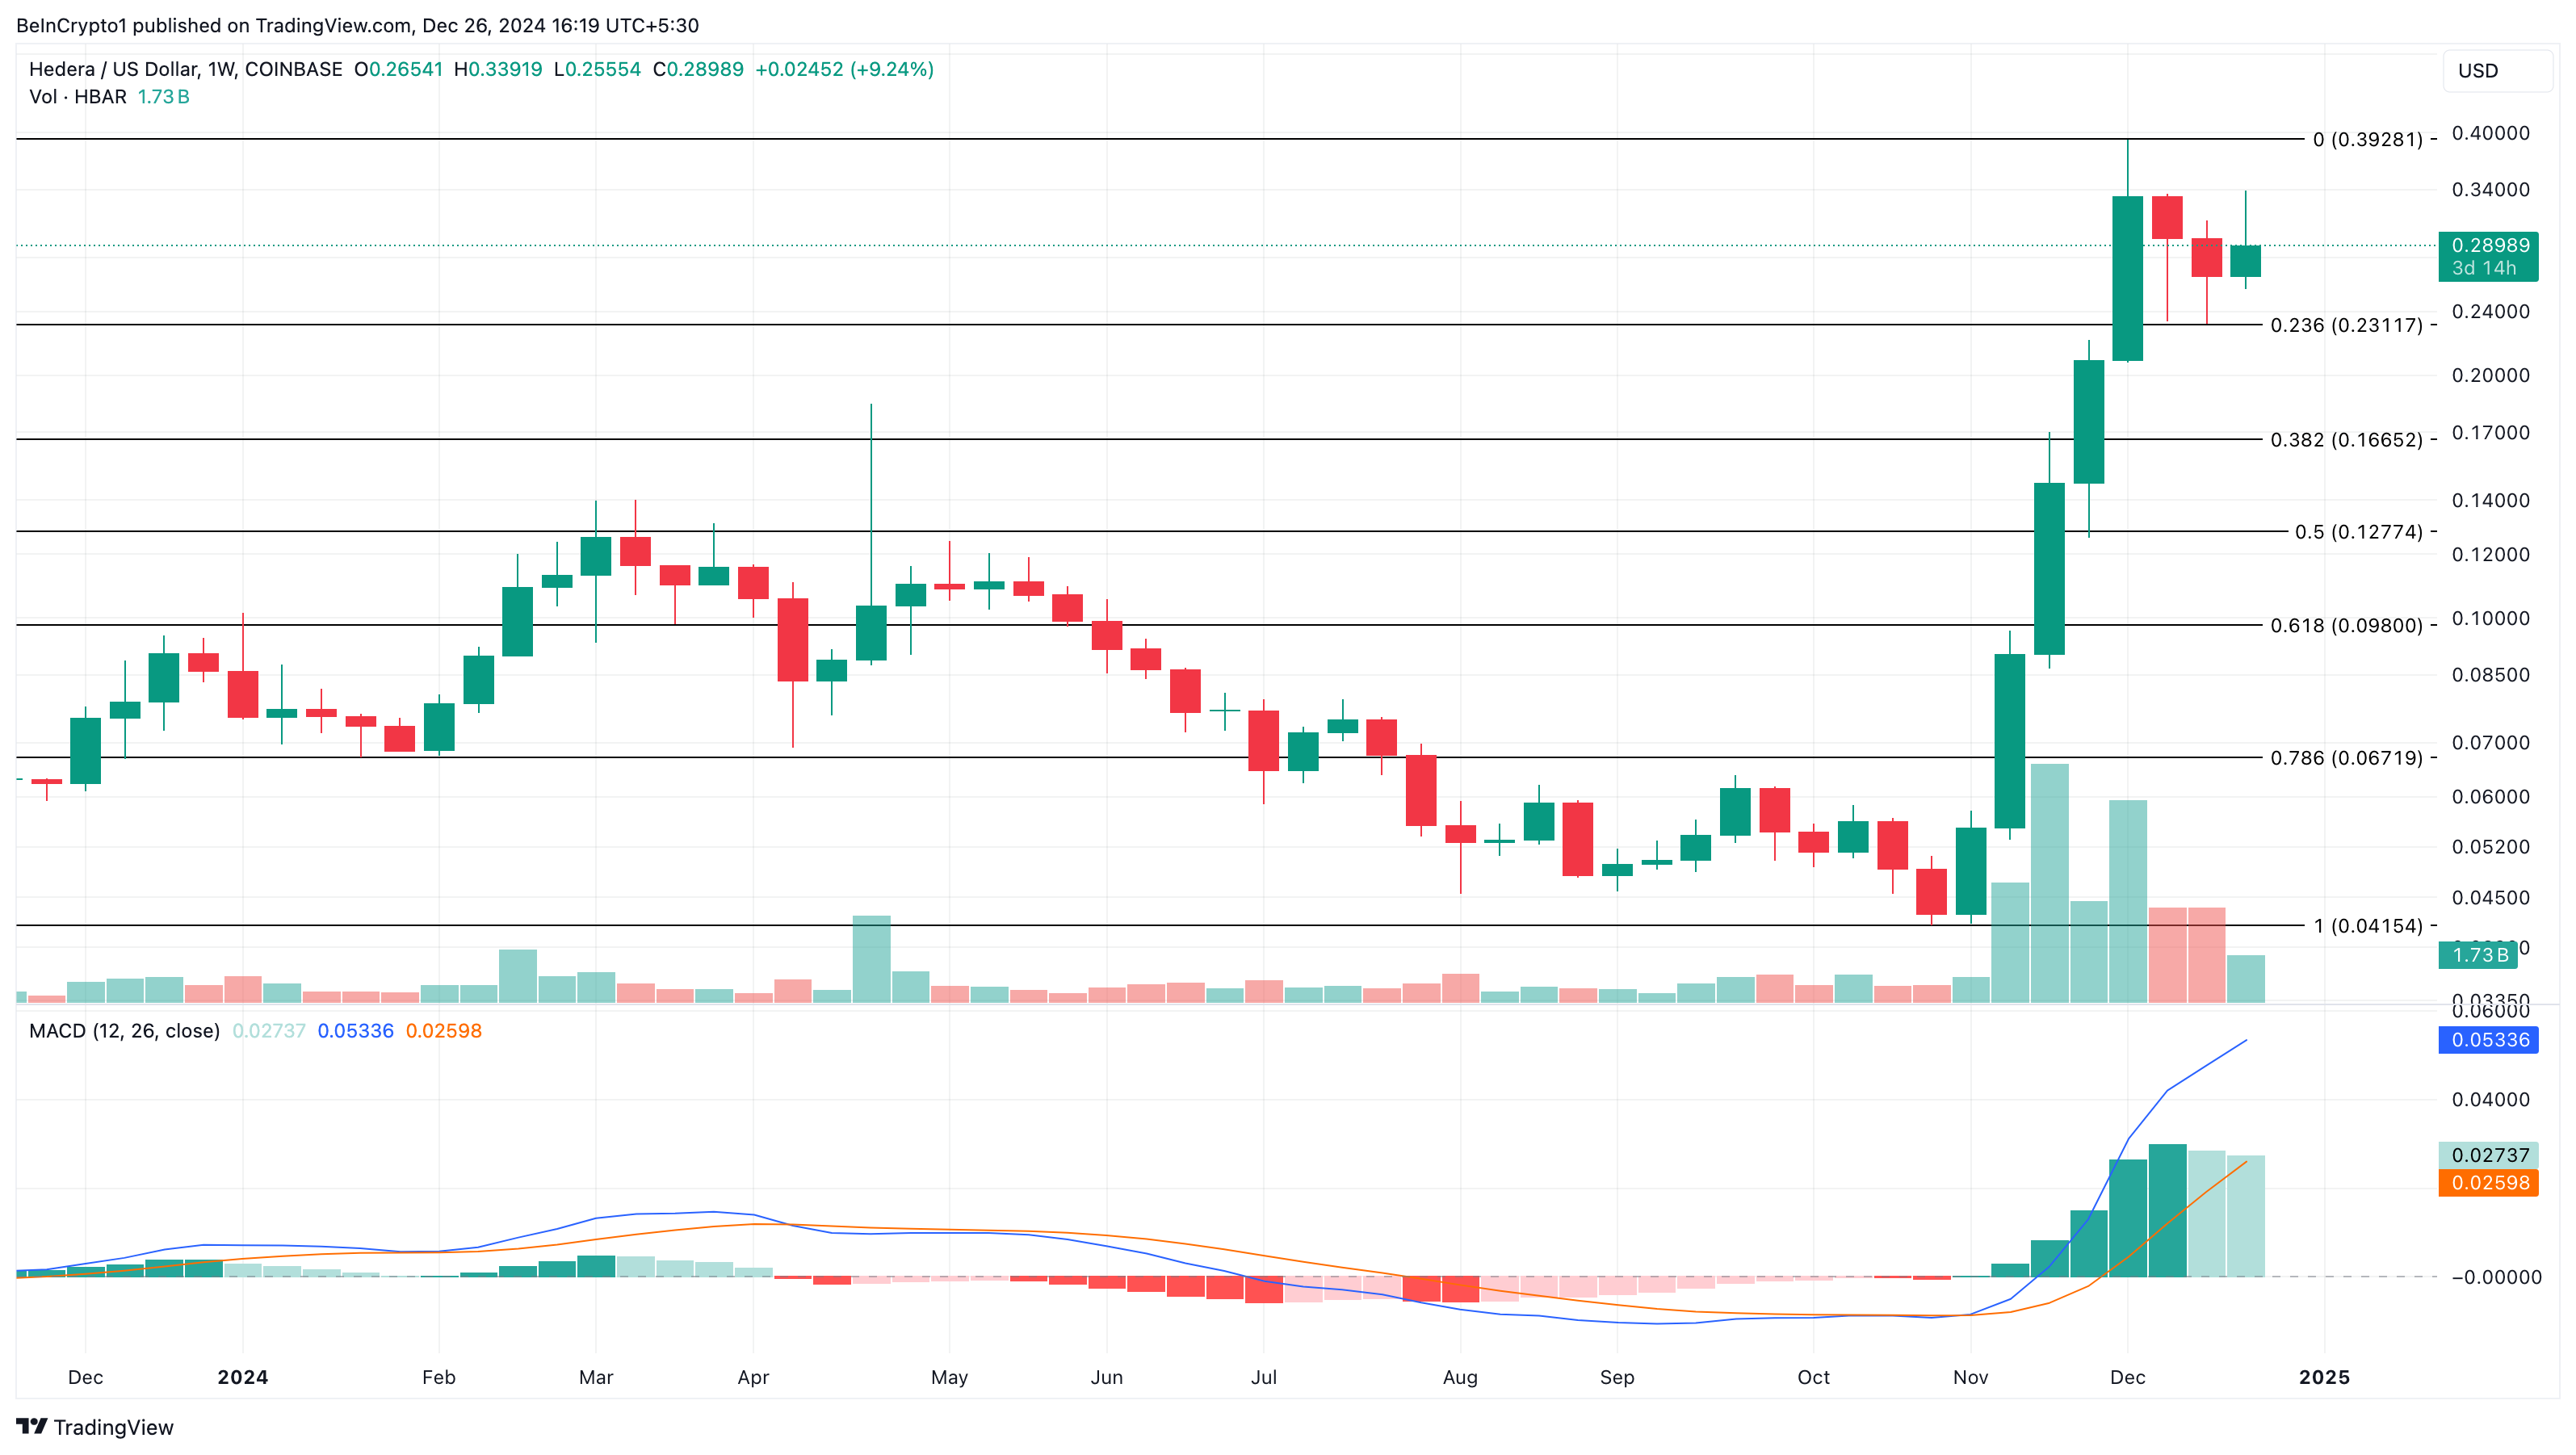
According to the weekly HBAR/USD chart, the Moving Average Convergence Divergence (MACD) is in positive territory. The MACD is a technical indicator that measures momentum by using the relationship between the 12 and 26-period Exponential Moving Average (EMA).
When the reading is positive, momentum is bullish. However, a negative MACD rating indicates that momentum is bearish. Thus, the current reading of the indicator suggests that HBAR’s price could climb higher in the short term.
Should the altcoin sustain the trend, the token’s value could rise to $0.40, as mentioned earlier. If buying pressure increases, it could jump toward the $1 mark.
 Hedera Weekly Analysis. Source:
TradingView
However, if the HBAR bull flag is invalidated, this might not happen. Instead, the cryptocurrency’s price might slide to $0.17.
Disclaimer: The content of this article solely reflects the author's opinion and does not represent the platform in any capacity. This article is not intended to serve as a reference for making investment decisions.
You may also like
[Initial Listing] Bitget Will List PrompTale AI (TALE). Come and grab a share of 3,480,000 TALE
New spot margin trading pair — LA/USDT!
AINUSDT now launched for futures trading and trading bots
Bitget releases June 2025 Protection Fund Valuation Report
