- Bitcoin’s social dominance rises as meme coin interest fades amid market volatility.
- Liquidations spike during Bitcoin rallies, indicating over-leveraged market positions.
- BTC’s RSI signals weak momentum, but MACD suggests potential stabilization.
Over the past two weeks, cryptocurrency market sentiment has changed sharply, with traders moving from bullish to bearish. This mood change has brought a significant correction in market caps, particularly among altcoins.
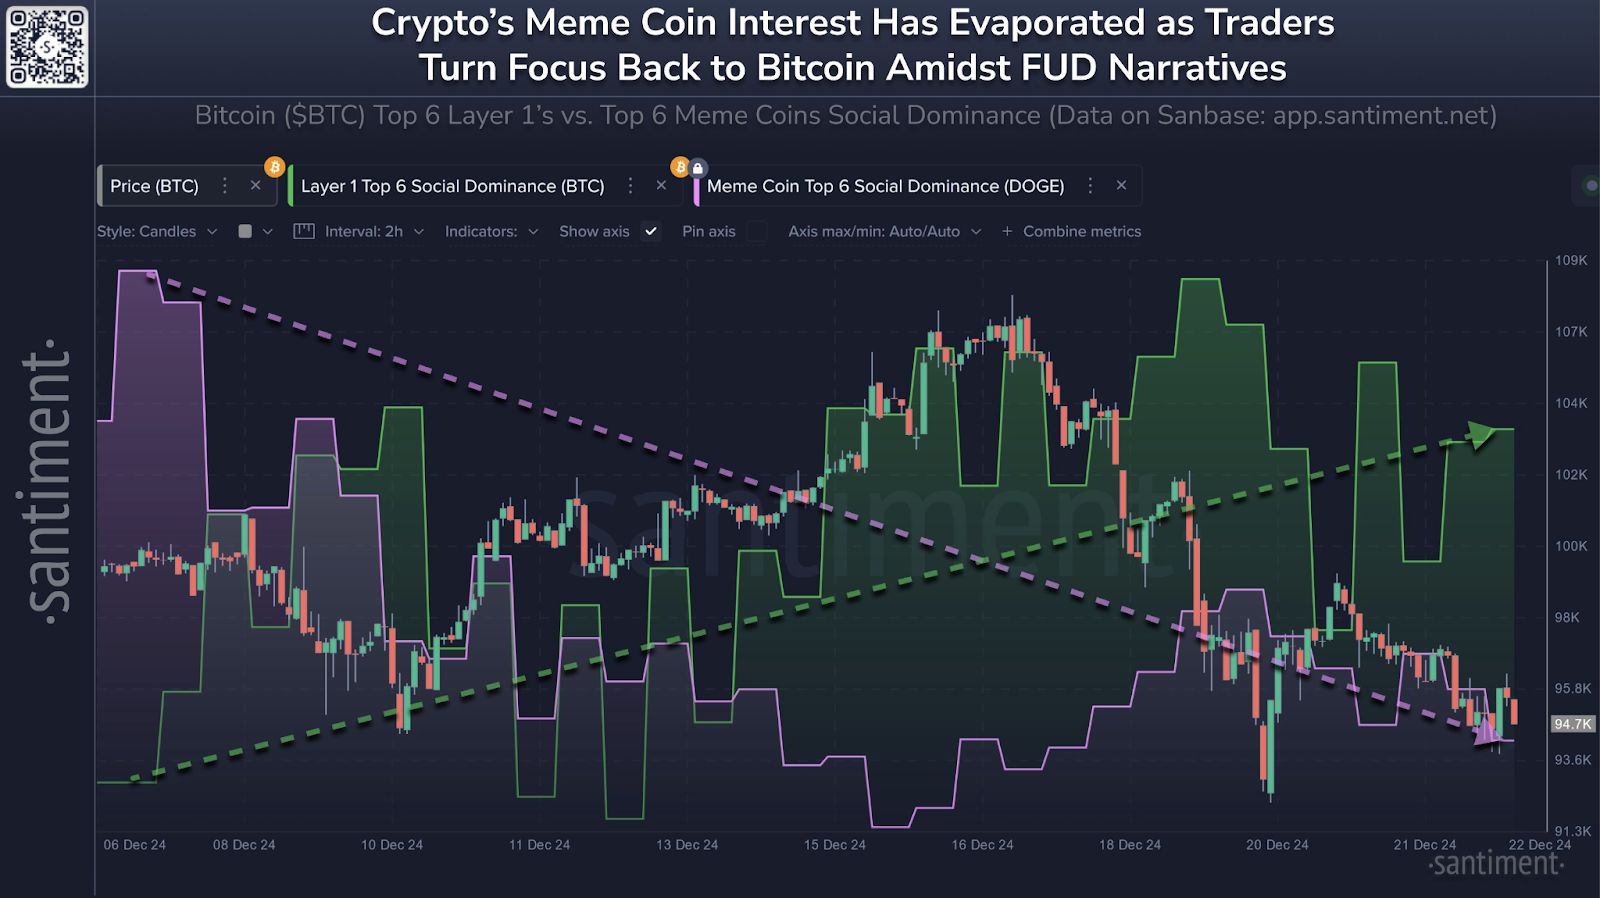
As interest in meme coins like Dogecoin wanes, Bitcoin is experiencing a resurgence in social dominance, suggesting a broader shift in focus back to the top cryptocurrency. This period of heightened fear, uncertainty, and doubt (FUD) is a natural part of the market cycle. Savvy traders can use this “blood in the streets” environment to position themselves for potential future gains.
Bitcoin’s Social Dominance on the Rise: What it Means for the Market
Santiment data shows a clear trend in the social dominance of Bitcoin . As Bitcoin’s price continues to capture trader attention, social conversations about the cryptocurrency have increased.
 Source: X
Bitcoin’s social dominance reflects this growing trend, which suggests that more traders are focusing back on Bitcoin as a safer, more established asset in uncertain market conditions. Meanwhile, the social dominance of meme coins has dipped, as shown by the purple line. This decline points to fading interest in speculative assets, particularly during market volatility.
Market Reactions and Liquidations: A Closer Look at the Data
Bitcoin’s price movements are closely tied to shifts in trader sentiment. The BTC price chart shows fluctuations between upward trends and short-term corrections, which correlate closely with changes in social dominance.
In addition, liquidations play a crucial role in gauging market sentiment. Recent data shows significant spikes in short liquidations, particularly during periods of price surges. Large spikes in short liquidations were recorded in early August, late November, and early December, suggesting that many traders betting against Bitcoin were caught off guard during these rallies.
Read also : Bullish 2025 for AI Solutions and Bitcoin as ETF Outperforms Gold
 Source: Coinglass
Conversely, long liquidations occur during price corrections, with notable events in mid-September and late October. These liquidation spikes, seen in both short and long positions, reflect the high level of market over-leveraging. Liquidation levels generally hover between $60M and $100M but can spike above $200M during periods of extreme volatility, as seen in early August and December.
Technical Indicators and Bitcoin’s Current Outlook: Where Do We Go From Here?
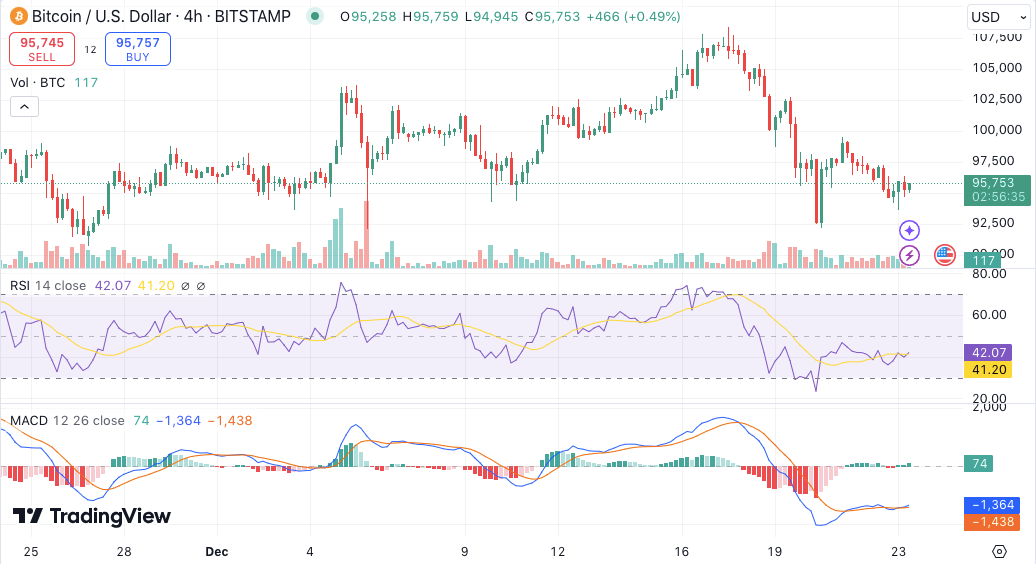
 BTC/USD 4-hour price chart, Source: Trading view
As of the press time trading at $95,851.34 , technical indicators show mixed signals at present. The Relative Strength Index (RSI) is currently at 41, indicating weak momentum, though it is not yet in oversold territory.
A further dip below 30 could trigger a rebound, especially if the market reacts to a more favorable macroeconomic environment. The Moving Average Convergence Divergence (MACD) shows bearish momentum, with the MACD line positioned below the signal line. However, the smaller size of the histogram bars suggests that selling pressure is easing, potentially signaling a shift toward stabilization.
Disclaimer: The information presented in this article is for informational and educational purposes only. The article does not constitute financial advice or advice of any kind. Coin Edition is not responsible for any losses incurred as a result of the utilization of content, products, or services mentioned. Readers are advised to exercise caution before taking any action related to the company.


