Solana Falls Short of $300 Breakout as SOL Sellers Dictate Price Movement

Solana struggles as sellers dominate, pushing its price below key support. Will buyers fuel a reversal to $300 or extend the bearish trend?
Despite showing a glimpse of moving higher, Solana (SOL) has once again failed to climb to the $300 mark. The inability to rise to this milestone could be linked to the dominance of Solana sellers, who have outpaced the buyers.
With bears leading the way, this analysis checks if SOL could escape another downturn or not.
Solana Bearish Momentum Prevails
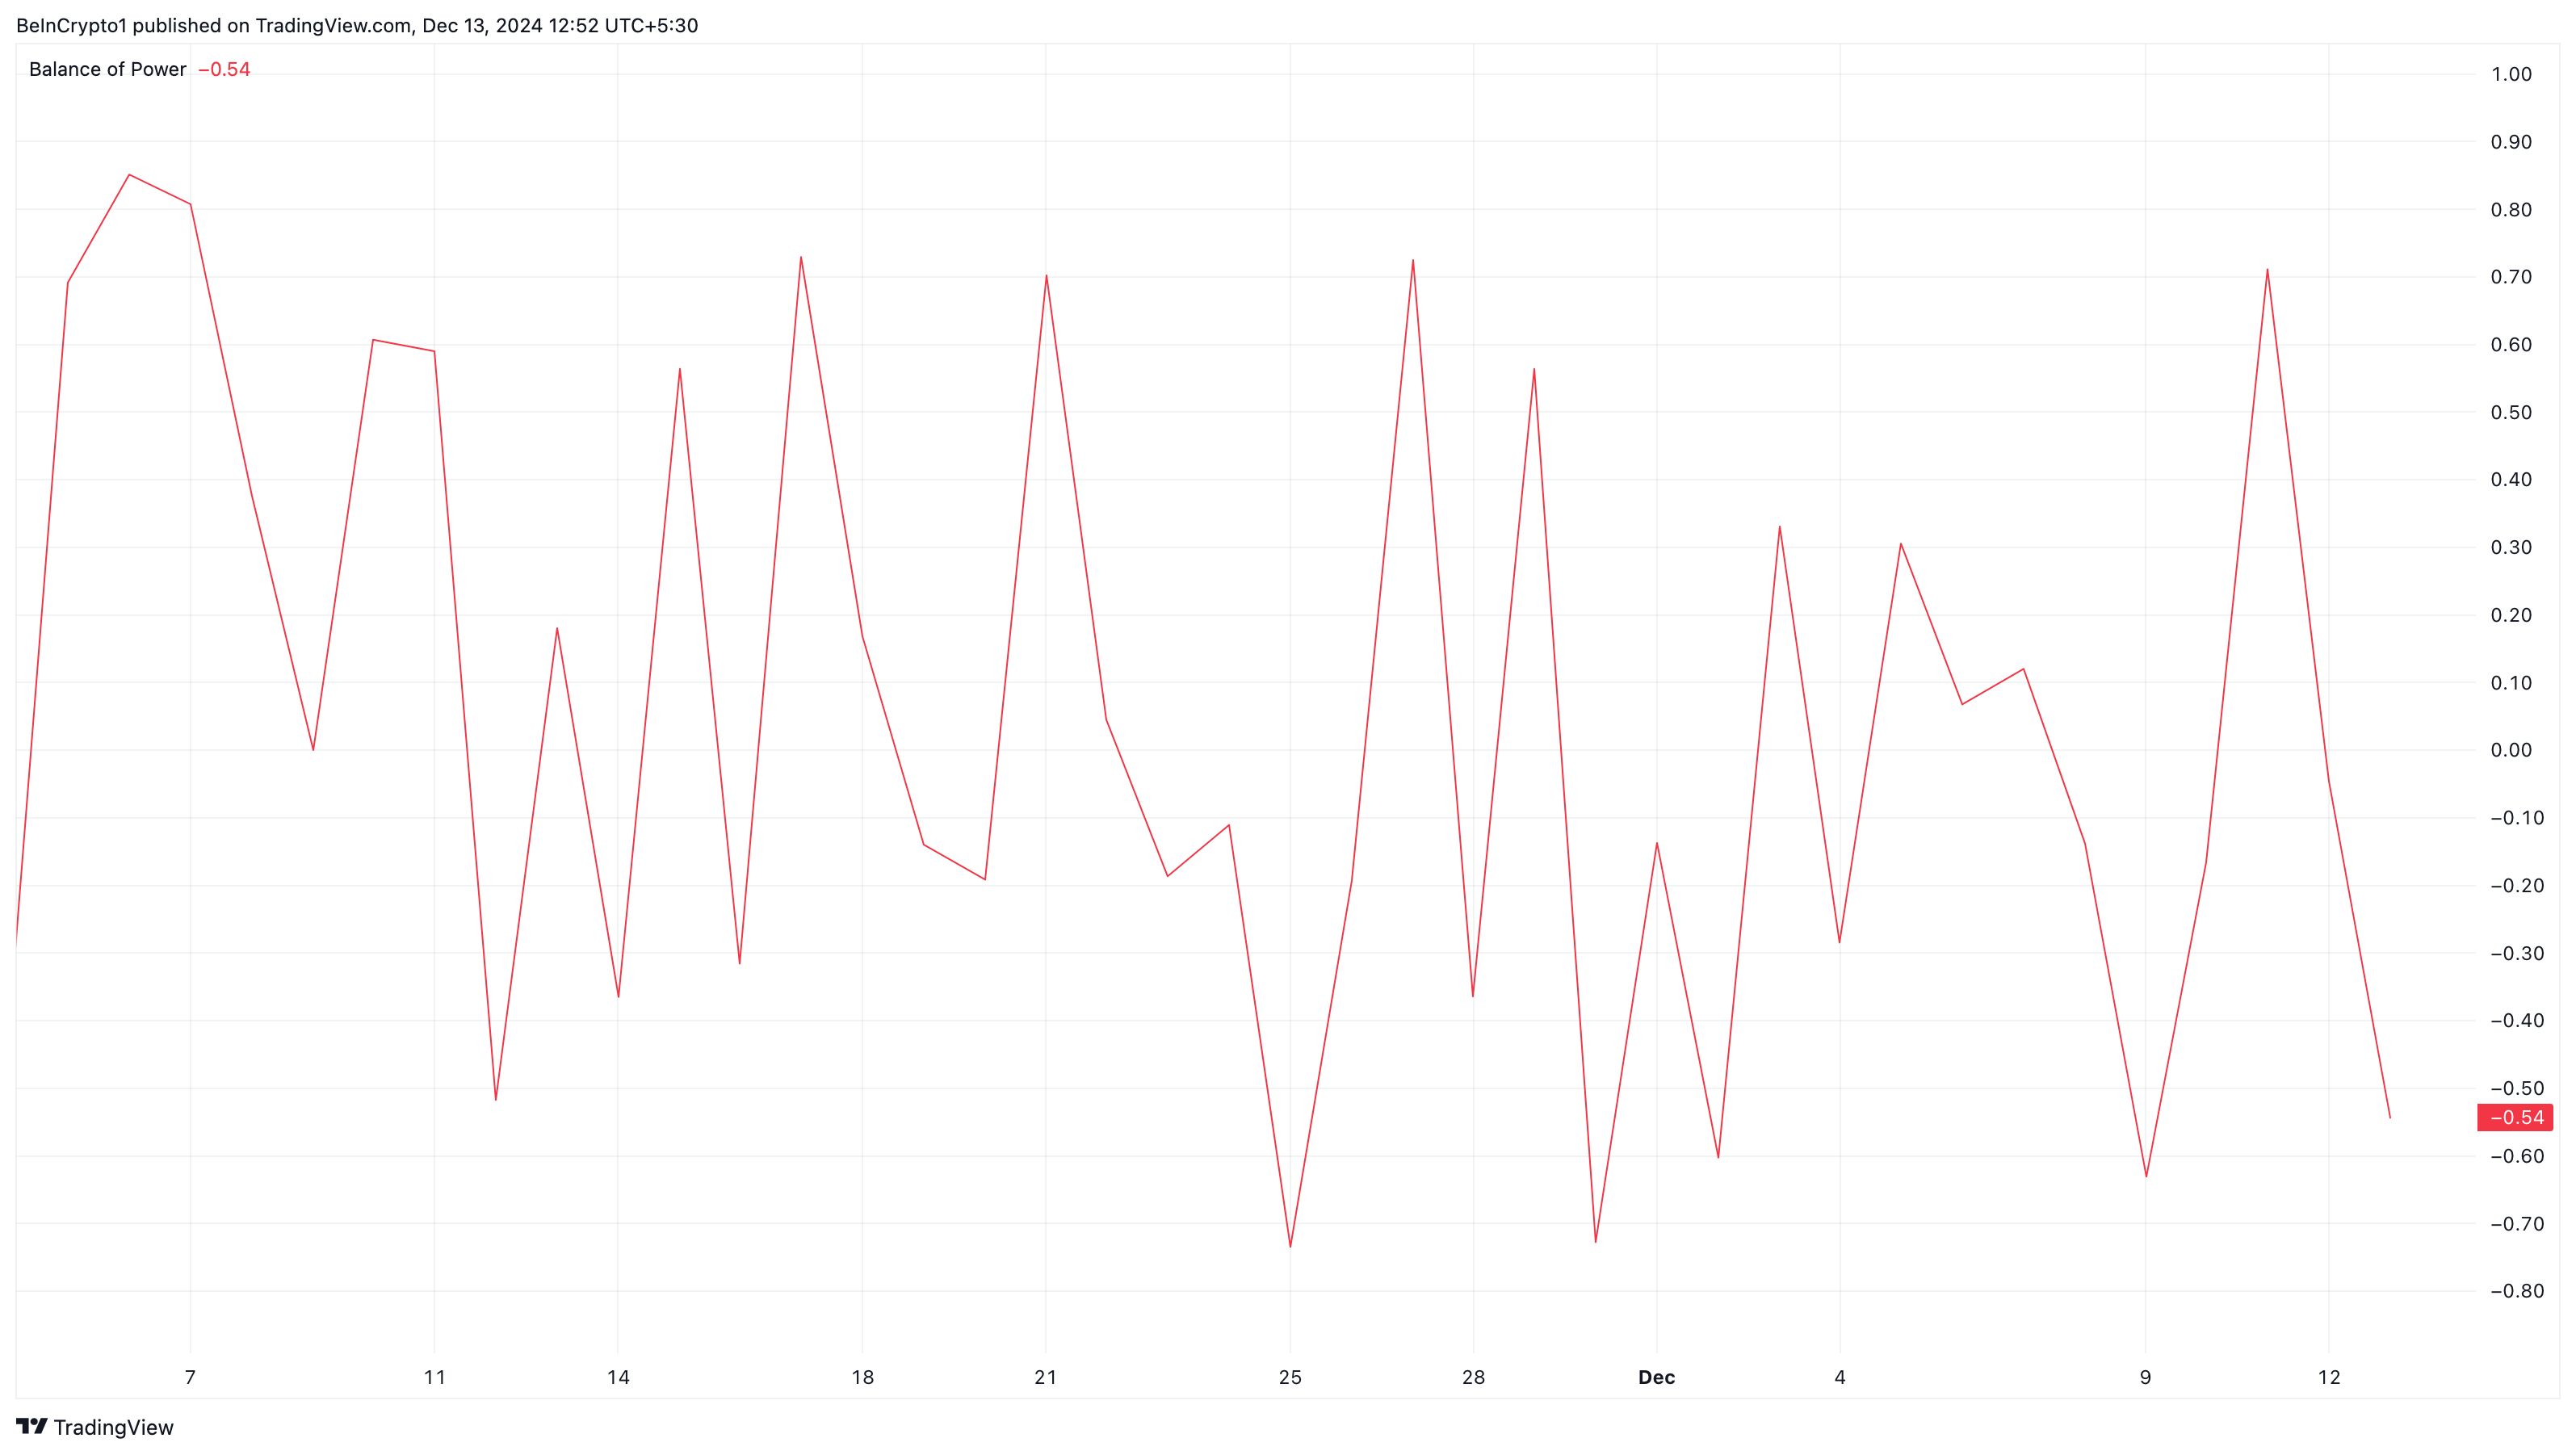
On the daily SOL/USD chart, BeInCrypto observed a drop in the Balance of Power (BoP) indicator into the negative zone. The BoP, a price-based technical indicator, assesses the strength and dominance of buyers versus sellers, offering traders valuable insights into market control dynamics and potential trend shifts.
A positive BoP value suggests that buyers hold the upper hand, suggesting a likely price increase. Conversely, a negative BoP reading implies that sellers are in control, increasing the risk of a price decline.
At press time, the BoP was at -0.54, highlighting the strong dominance of Solana sellers and indicating potential bearish momentum for Solana’s price.
 Solana Balance of Power. Source:
TradingView
Solana Balance of Power. Source:
TradingView
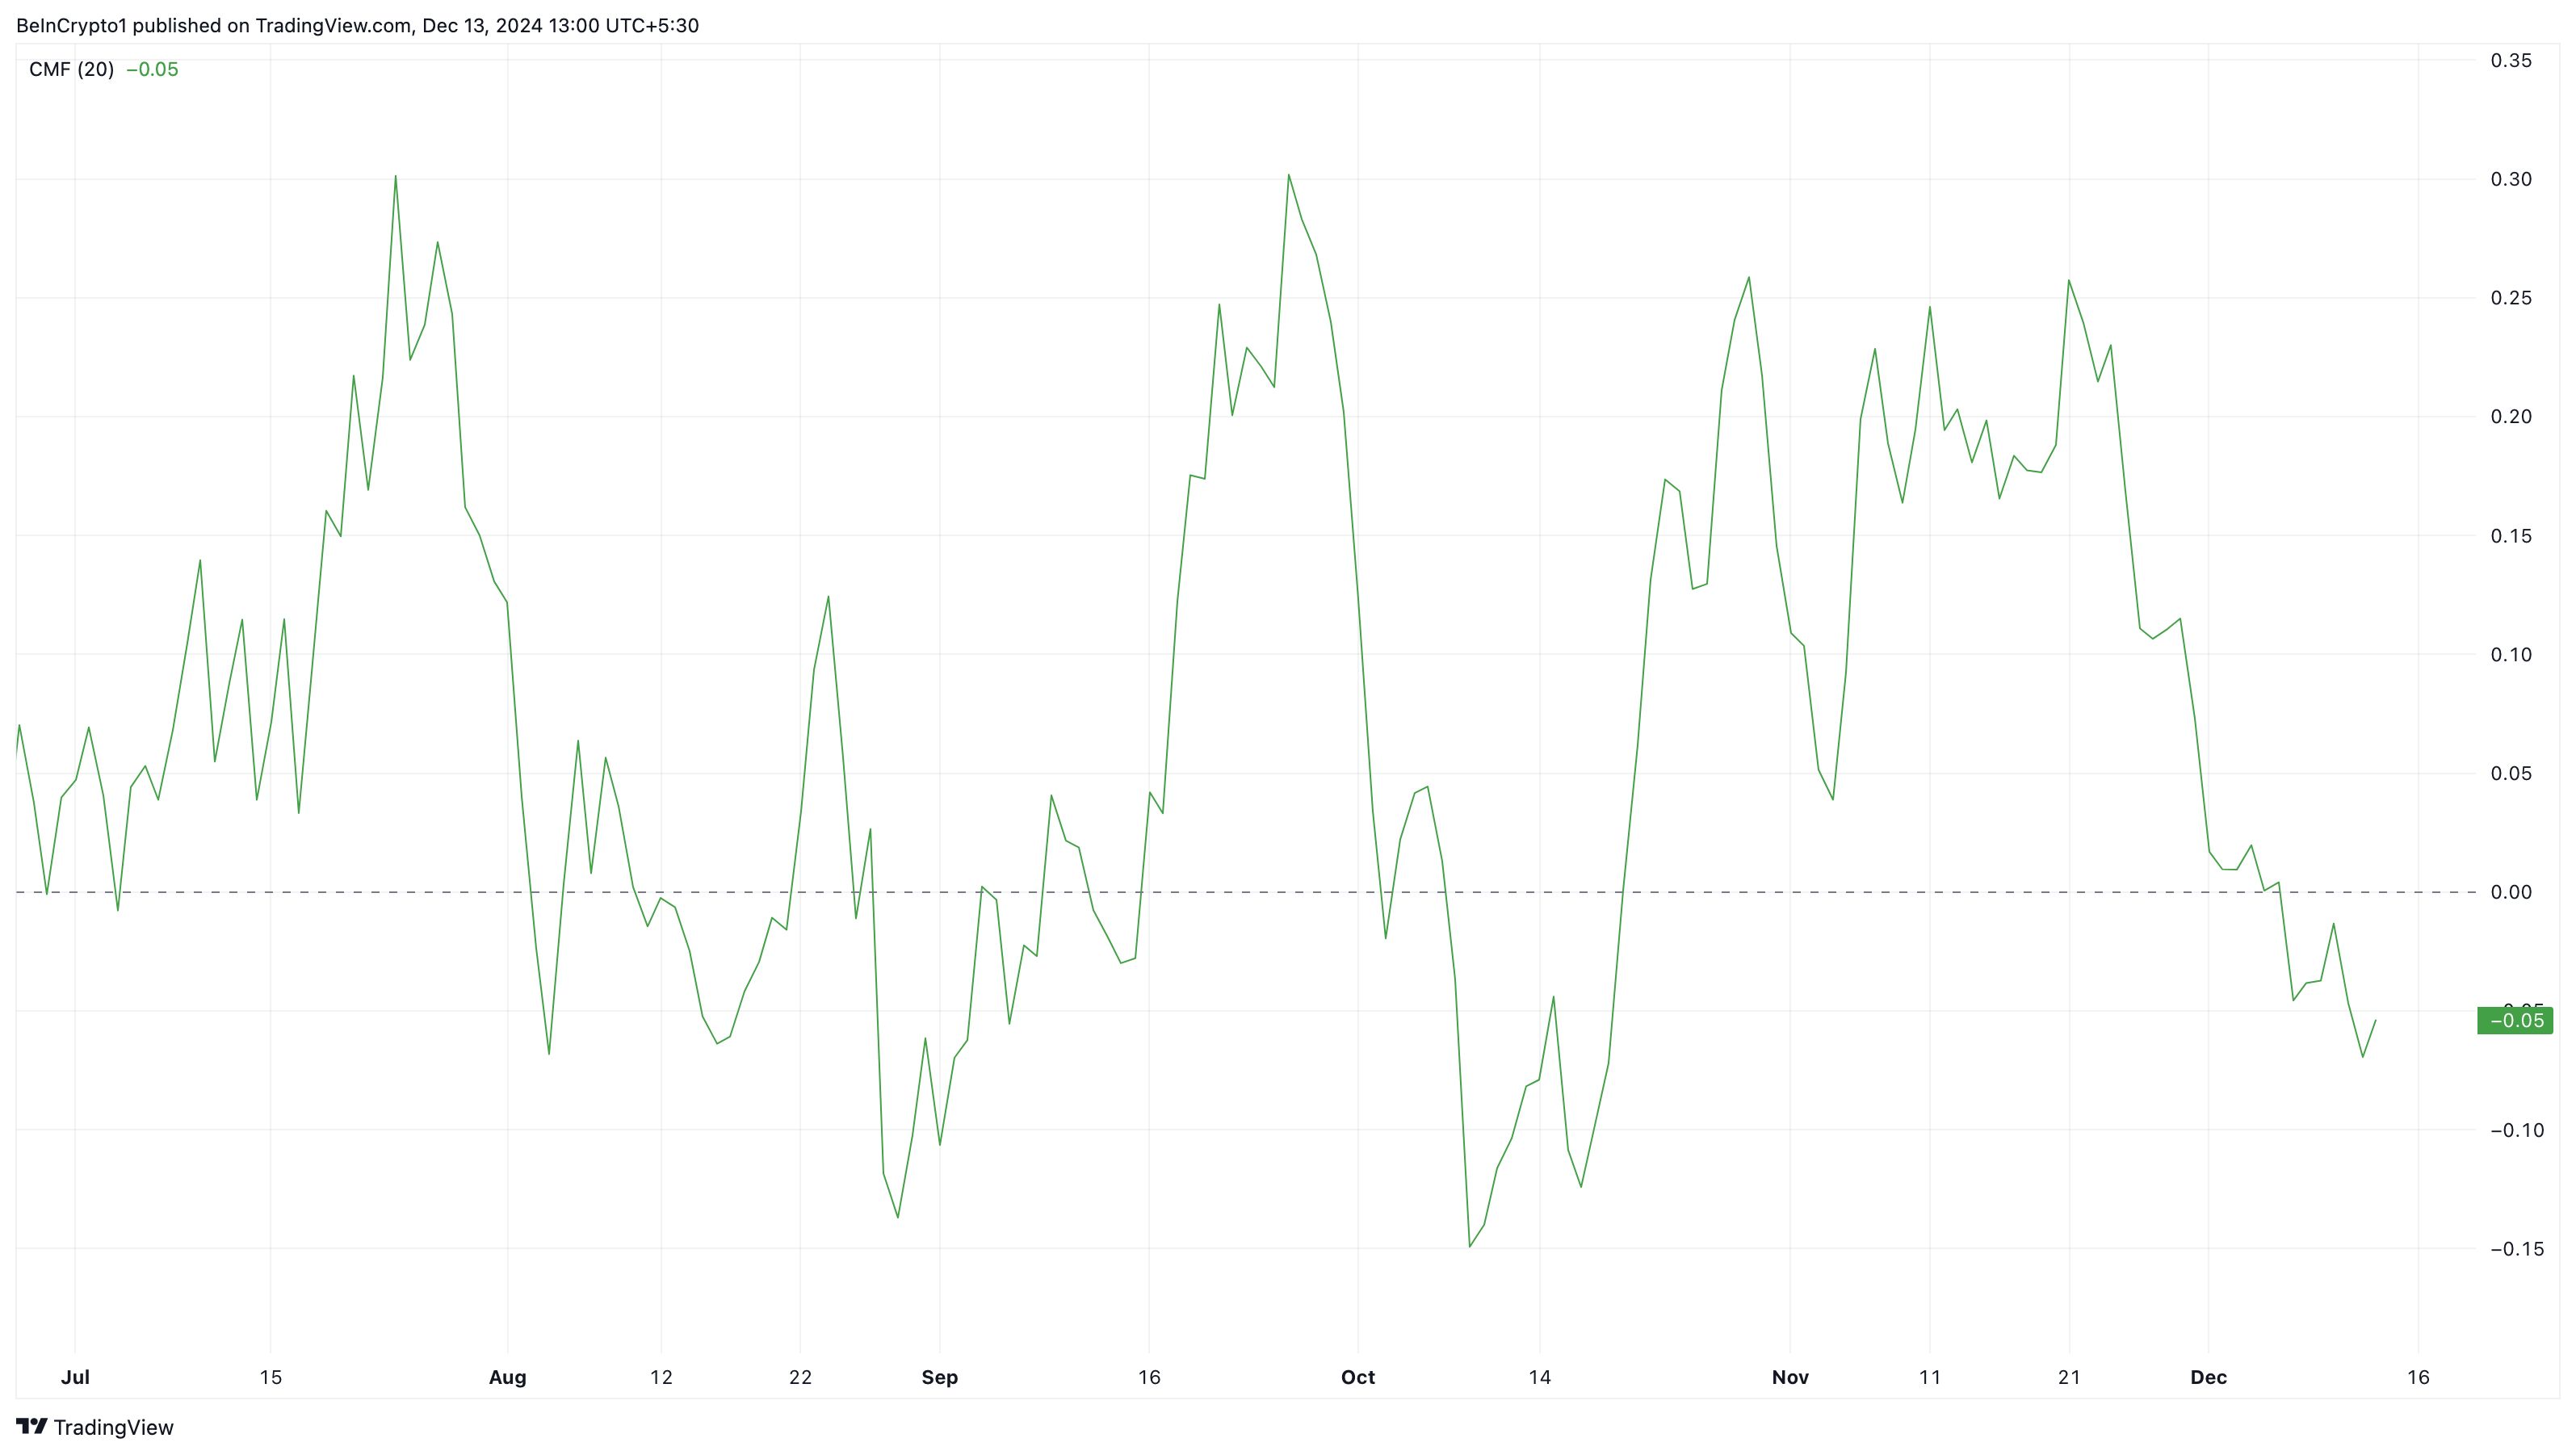
Another indicator suggesting a potential decline in SOL price is the Chaikin Money Flow (CMF). The CMF is a technical indicator that measures the flow of liquidity into or out of a cryptocurrency.
By employing the price and volume data, the indicator identifies periods of accumulation (buying pressure) and distribution (selling pressure). Positive CMF values indicate strong accumulation, suggesting upward momentum, while negative values reflect distribution and potential bearish trends.
As of this writing, the CMF on the Solana daily chart has dropped to the negative region. At -0.05, the current rating reinforces the notion that Solana sellers have kept bulls at bay. If this trend continues, then SOL price might continue to decline.
 Solana Chaikin Money Flow. Source:
TradingView
Solana Chaikin Money Flow. Source:
TradingView
SOL Price Prediction: Support Broken, Downturn Continues
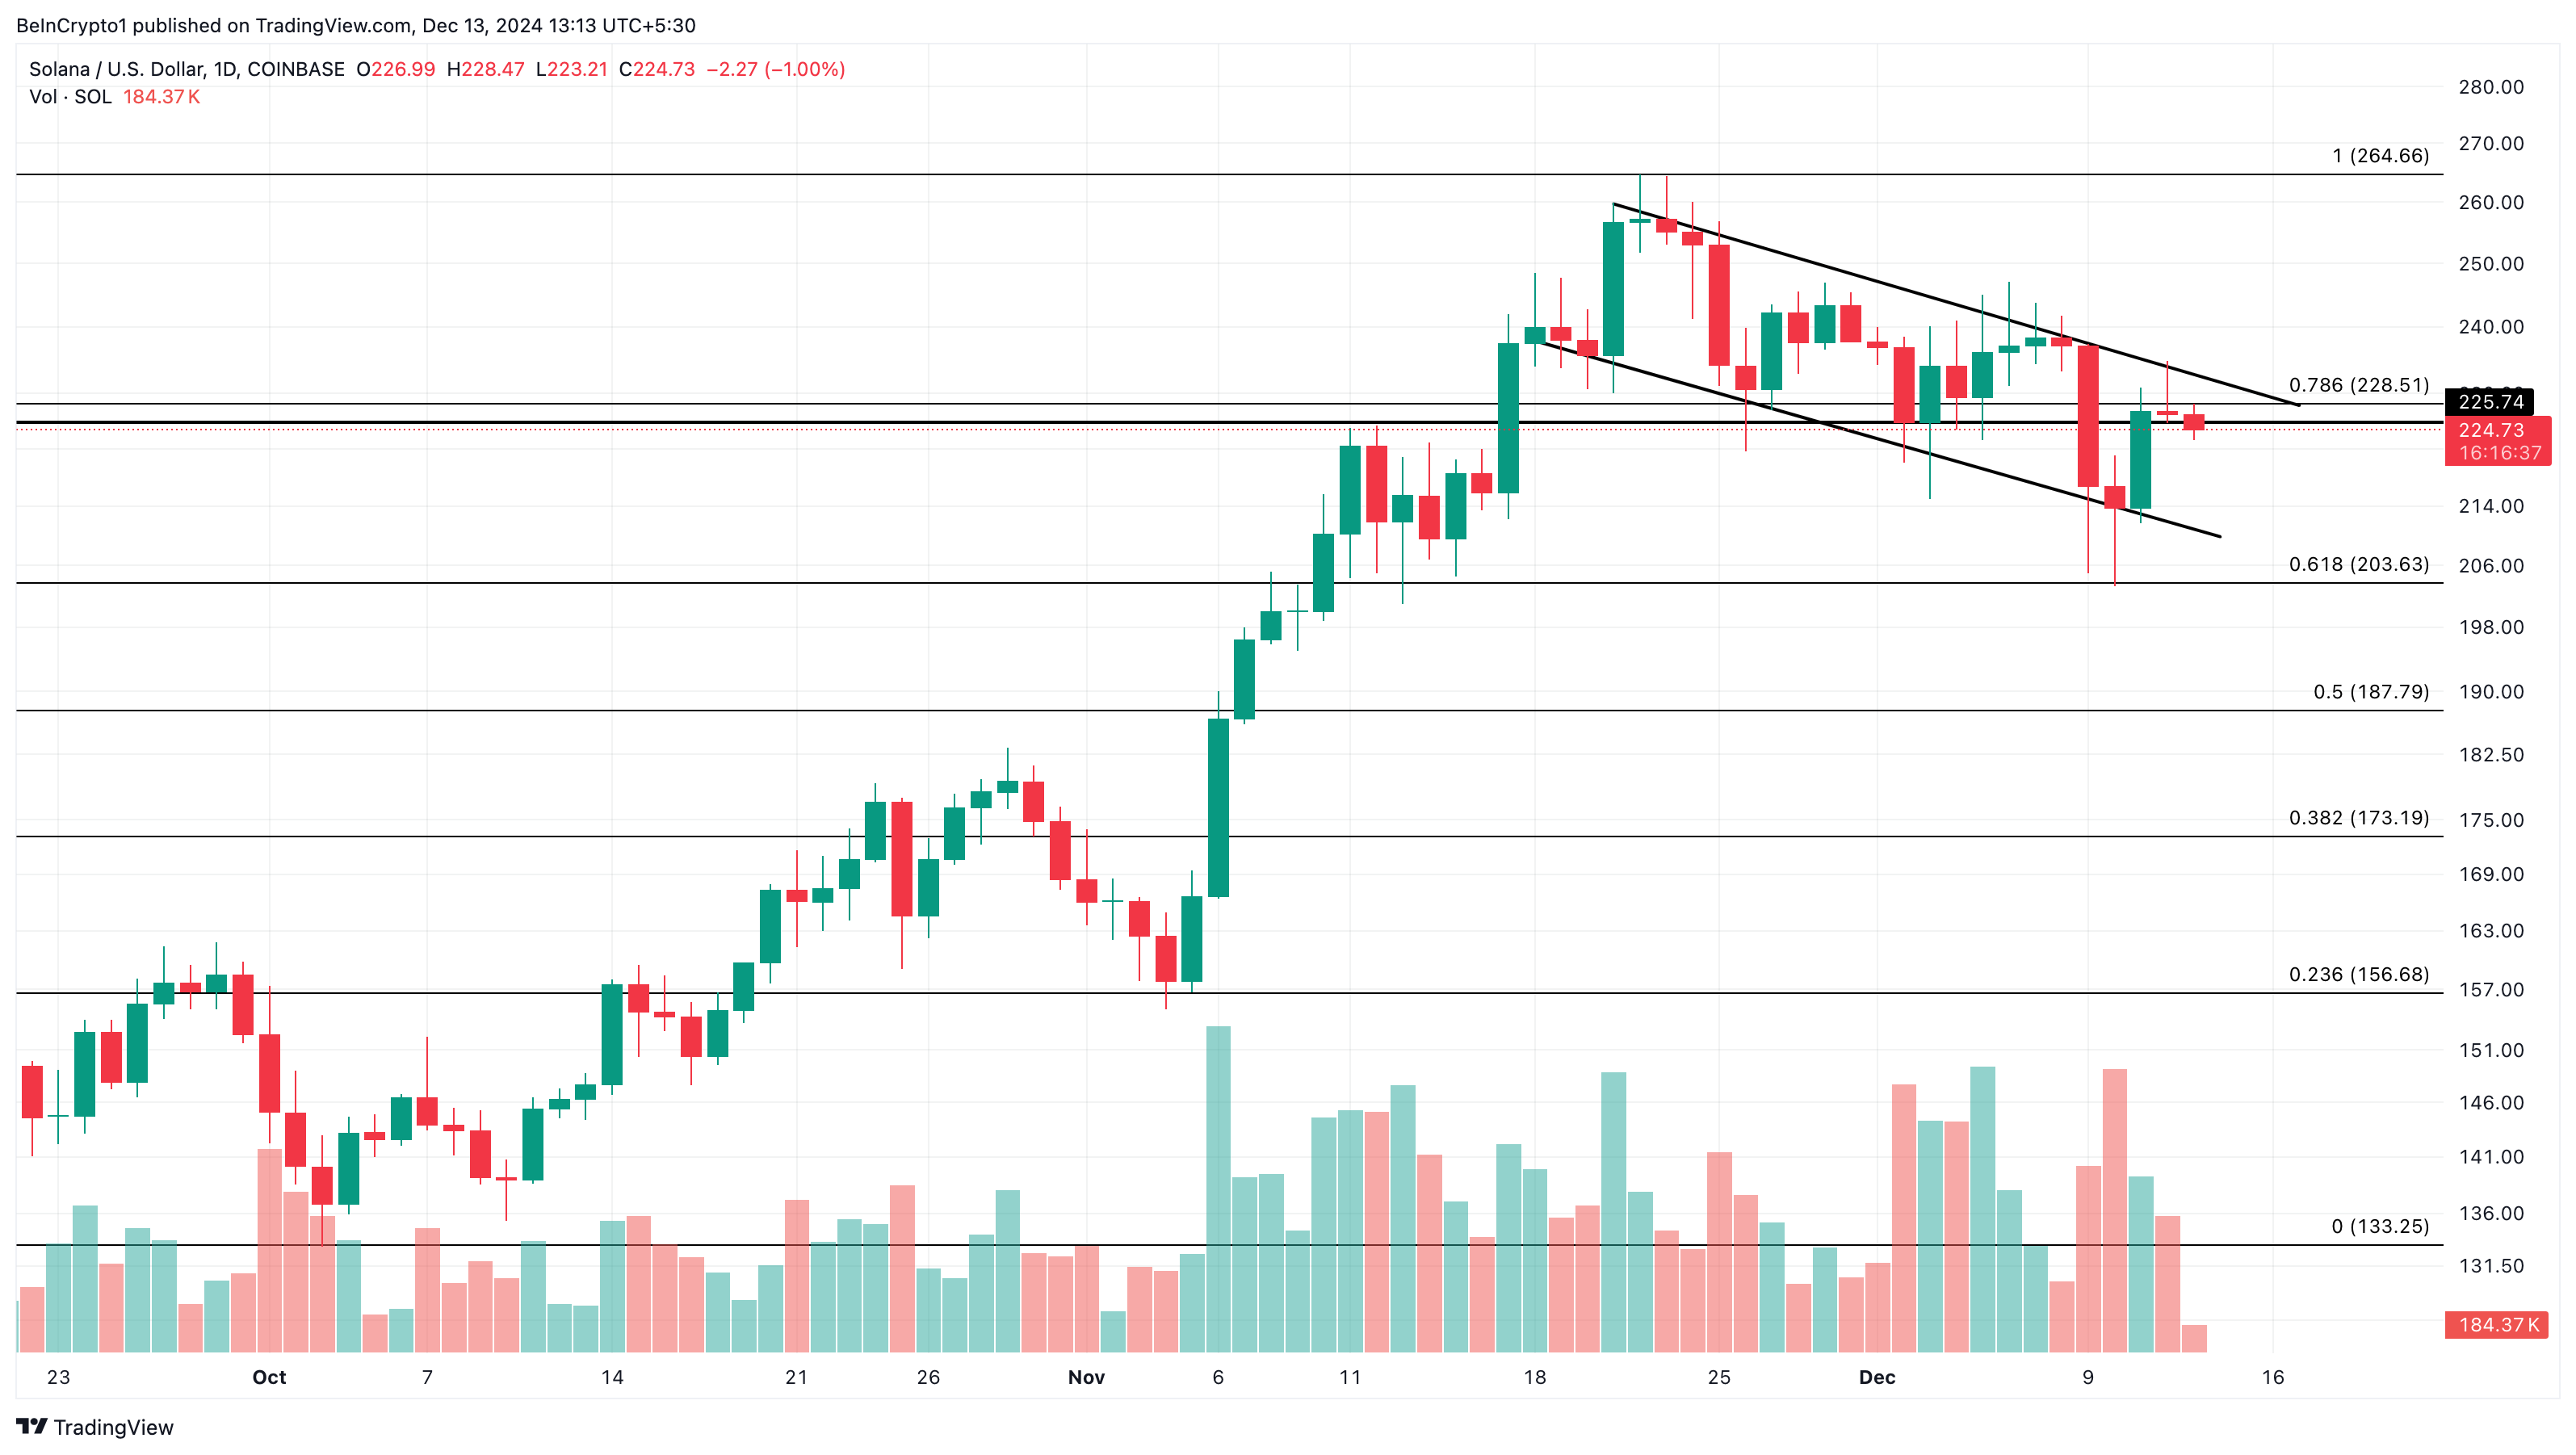
Based on the daily chart, Solana’s price has been trading within a descending channel since it reached a new all-time high on November 22. Notably, the image below shows that the altcoin’s value has slipped below the support at $225.74.
The downturn below this support suggests that the SOL price risks another significant correction. If validated, the token could slide to $203.63 as long as Solana sellers continue to remain in control.
 Solana Daily Analysis. Source:
TradingView
Solana Daily Analysis. Source:
TradingView
On the flip side, if buyers take over, this forecast might not come to pass. In that scenario, the cryptocurrency’s value could rise to $264.66. In a highly bullish scenario, the altcoin could eventually break out to $300.
Disclaimer: The content of this article solely reflects the author's opinion and does not represent the platform in any capacity. This article is not intended to serve as a reference for making investment decisions.
You may also like
Meteora launches Meteora Rising incubator
SlowMist: Encryption users should be wary of browser plug-ins being sold to malicious parties