- TTX targets $0.30 as Justin Sun’s bold claim sparks comparisons with XRP’s recent 400% surge.
- TRX shows bullish patterns with technical indicators signaling a possible breakout above $0.225.
- XRP inspires TRX’s momentum as parallels emerge in market trends and investor sentiment.
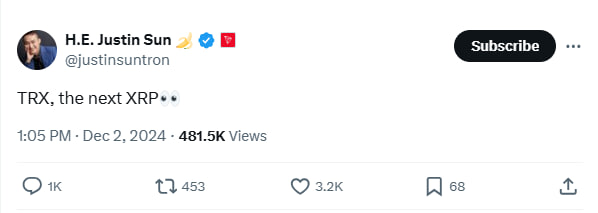
Justin Sun, founder of TRON , hinted at a bright future for TRX, comparing it to XRP’s market performance. His statement, “TRX, the next XRP,” became a trending topic among crypto investors on X.

Supporters marked this off as a positive long-term prediction. Skeptics, however, feel it may be a move to boost TRX’s visibility. X user PC PR1NCIPAL argued that TRX lacks the buying conviction for sustained rallies.
The user pointed out the absence of a major investor with enough liquidity to execute consistent high-volume trades. This comes as XRP experiences renewed interest, driven by legal victories and growing adoption in cross-border payments.
Parallels Between XRP and TRX Market Trends
TradingView data shows XRP, currently trading at $2.55, has surged over 400% in the past month, marking a decisive upward momentum similar to its 2017-2018 bull run. Following this surge, the cryptocurrency broke above its 2021 high of $1.96 and is now eyeing its all-time high of $3.84 as the bull market continues.
This resurgence follows years of consolidation driven by the extended Ripple-SEC lawsuit, which capped its price trajectory until now. Meanwhile, TRX, trading at $0.209, has shown steady growth over the years, surpassing its 2021 high of $0.184.
These technical breakout patterns align with Sun’s optimistic outlook, indicating that TRX may mirror XRP’s growth trajectory. TRX is now setting its sights on its all-time high of $0.30, a milestone that could validate its long-term bullish possibility.
TRX Market Technical Analysis
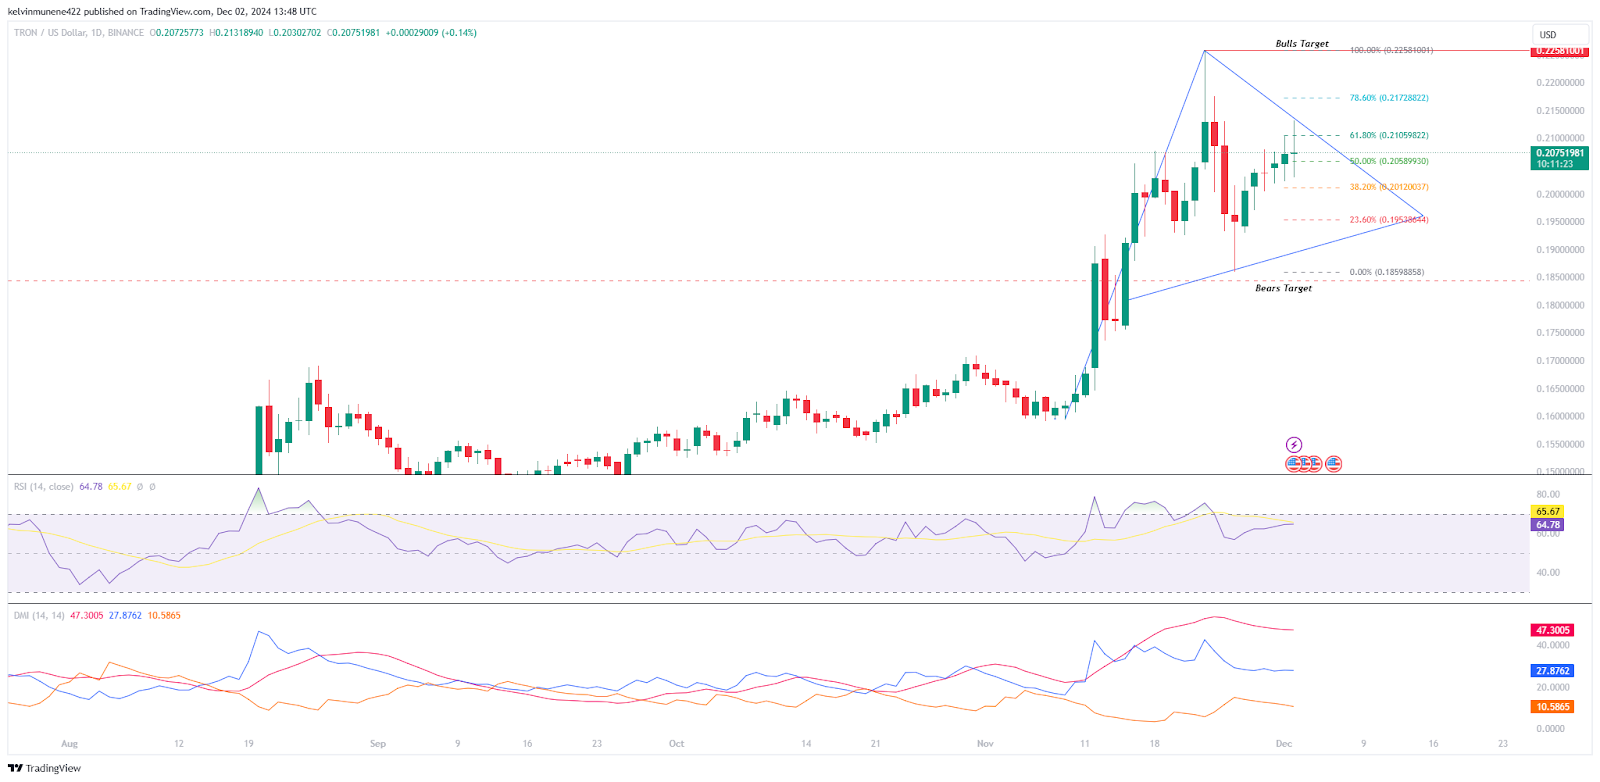
A closer look at TRX’s daily chart reveals a pennant flag pattern, typically signalling a continuation of a bullish trend. TRX is now consolidating above the 50% Fibonacci level at $0.205, a key support zone. This level aligns with a consolidation phase following a strong rally earlier in the month.
 Source: TradingView
Technically, the Relative Strength Index at 65.67 indicates bullish momentum, although it is approaching overbought territory. This suggests that while buying pressure remains potent, traders should remain cautious of likely short-term pullbacks or profit-taking.
The Directional Movement Index reinforces the bullish narrative, with the +DI line at 27.8762 positioned above the -DI line at 10.5865, indicating buyers dominate the market. Moreover, the Average Directional Index at 47 underscores the current trend’s strength, suggesting a breakout could be imminent.
Key Levels to Watch for TRX
TRX may reach $0.225 in the coming days. However, for this scenario to unfold, it must close the day above $0.217, which coincides with the 78.6% Fibonacci retracement level.
Conversely, a breakdown below the 38.2% Fib at $0.201 could expose the coin to retesting lower support areas, including $0.195 at the 23.6% Fib. A breach below this zone might invalidate the uptrend setup, driving the token toward $0.185 and threatening to derail its bull run.
Disclaimer: The information presented in this article is for informational and educational purposes only. The article does not constitute financial advice or advice of any kind. Coin Edition is not responsible for any losses incurred as a result of the utilization of content, products, or services mentioned. Readers are advised to exercise caution before taking any action related to the company.

