Tron (TRX) Hits New All-Time High, Surpassing 2018 Milestone of $0.22

Tron (TRX) has hit a new all-time high of $0.23, surpassing its 2018 peak. Learn the factors behind this rally and the future outlook for TR
Tron (TRX) has reached a new all-time high today after the price rallied by 12% in the last 24 hours to reach $0.23. The development also ensures that the altcoin’s market cap climbed above $20 billion, which is also a new high.
This significant surge could be linked to the broader rally in altcoins’ value and rising institutional and retail interest in the token. But will TRX’s price continue to rise?
Tron Rising Demand Drives It to New Peak
Thirty days ago, Tron’s price was $0.16. After a 41.02% hike since then, it sits at a new all-time high. Before this milestone, TRX’s all-time high was in June 2018, when its value climbed to $0.22 and was below this threshold for a long period.
But with rising buying pressure over the last few weeks, Tron’s price hit 0.23, and speculation spread that it could go higher.
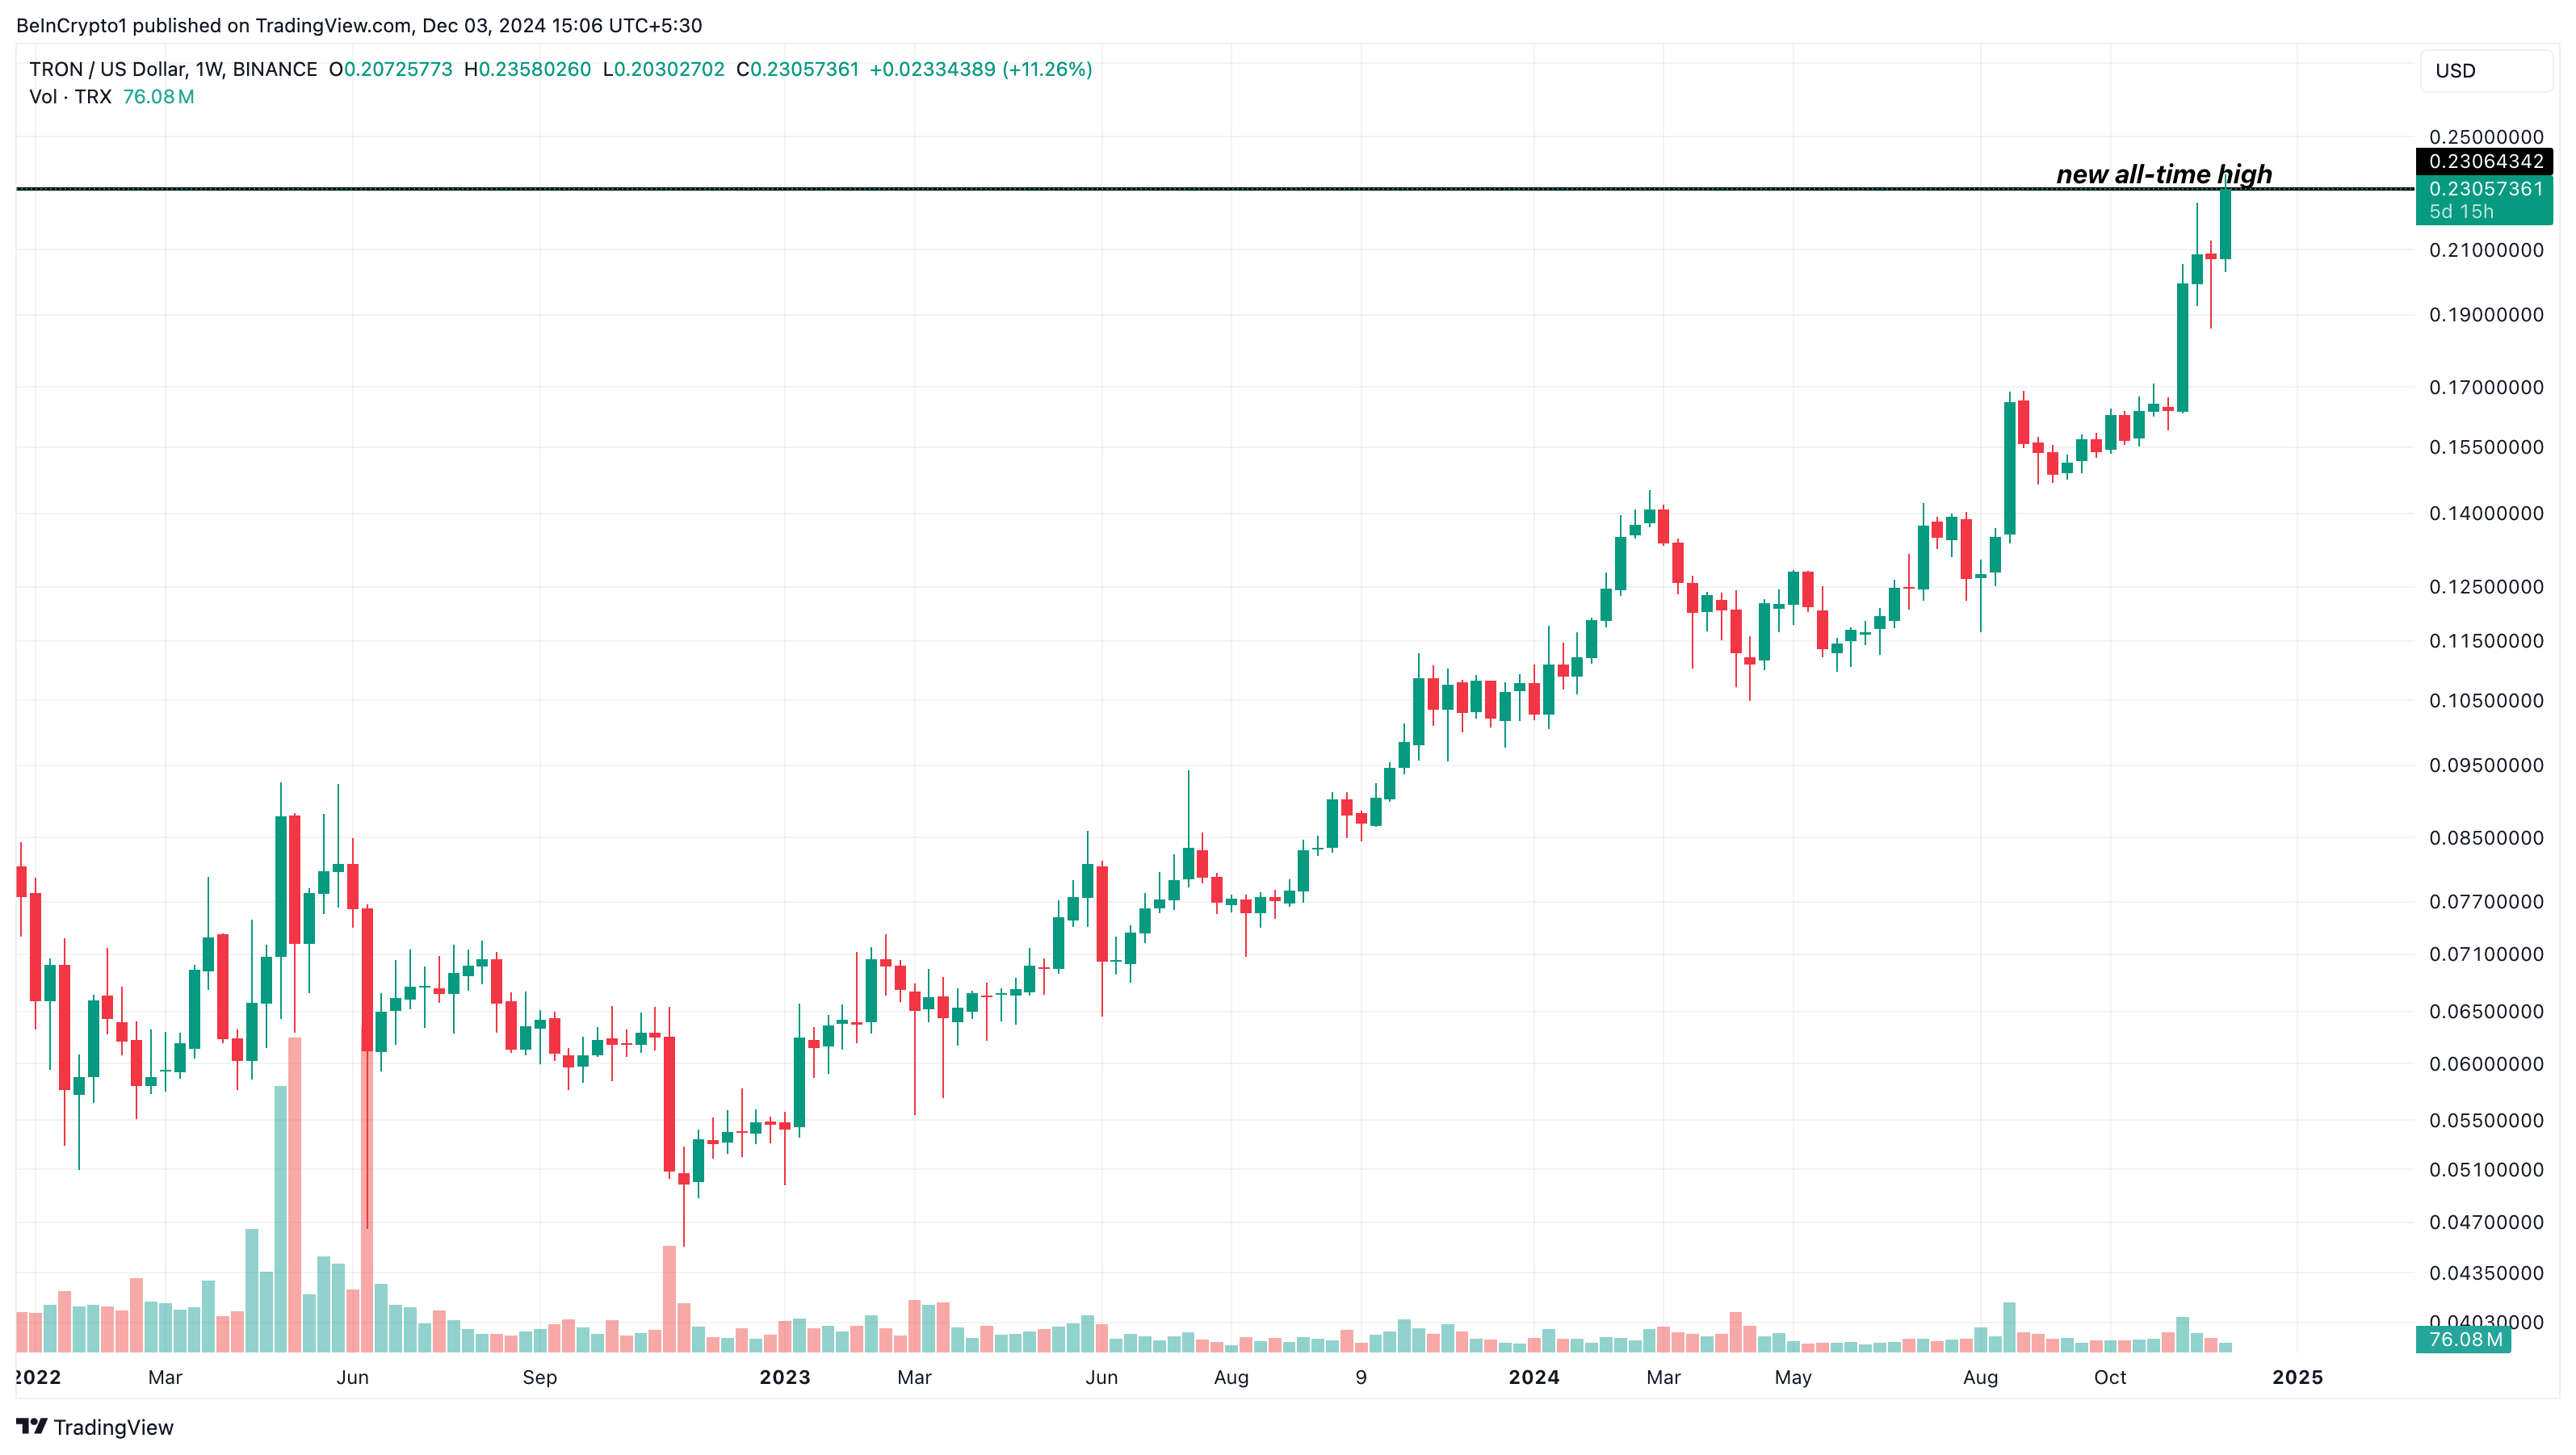 Tron New All-Time High. Source:
TradingView
Tron New All-Time High. Source:
TradingView
One indicator suggesting that TRX’s value could go higher is the Global In/Out of Money (GIOM). The GIOM shows the average cost for each address based on the weighted average price of tokens purchased or received. By clustering addresses that bought tokens at similar price levels, the GIOM provides an aggregate view of the profitability of a particular crypto asset.
These clusters represent significant support or resistance. Larger clusters indicate higher concentrations of positions at specific price ranges, which can act as psychological barriers in the market.
If prices approach a large “In the Money” cluster, it may indicate strong support. Conversely, approaching a large “Out of the Money” cluster could indicate resistance, as holders might sell to minimize losses. In Tron’s case, 100% of addresses are in the money, suggesting solid resistance and potential to climb higher.
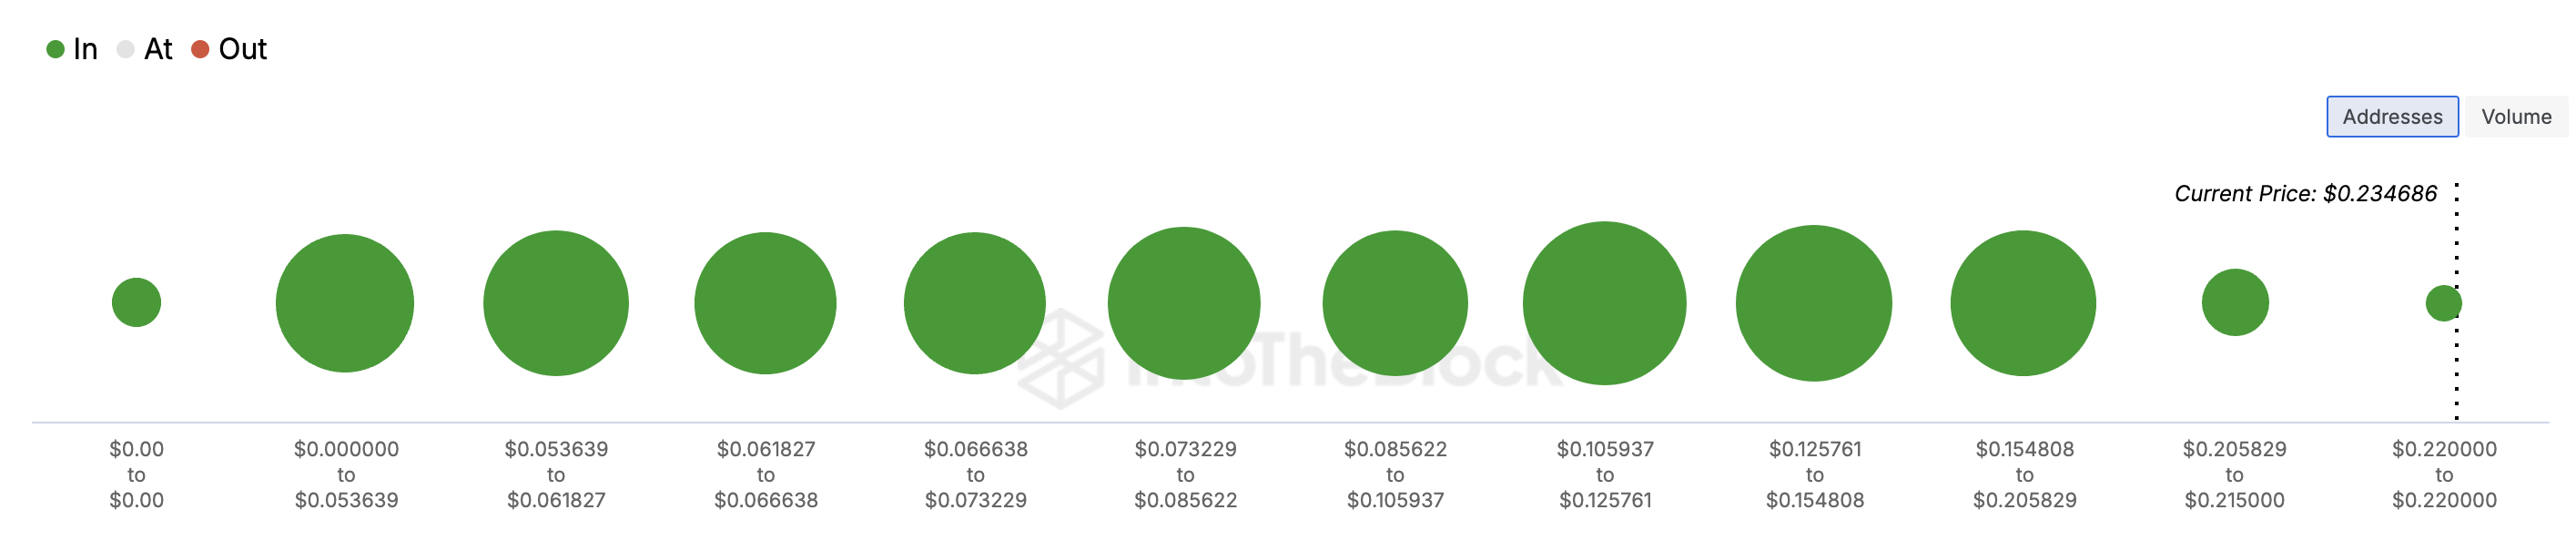 Tron Global In/Out of Money. Source:
IntoTheBlock
Tron Global In/Out of Money. Source:
IntoTheBlock
TRX Price Prediction: Upswing Not Over
A look at the TRX/USD daily chart shows that the Chaikin Money Flow (CMF) has climbed. The CMF is a technical indicator that evaluates the flow of money into and out of an asset over a specific timeframe.
It is measured using the current price’s closeness to the period’s high and low, weighted by trading volume. If the closing price is near the high, it suggests buying pressure. On the other hand, if the closing price is near the low, it suggests selling pressure.
Since the CMF is above zero, Tron’s uptrend is strong. If bulls help sustain this trend, the altcoin’s value could climb to $0.30.
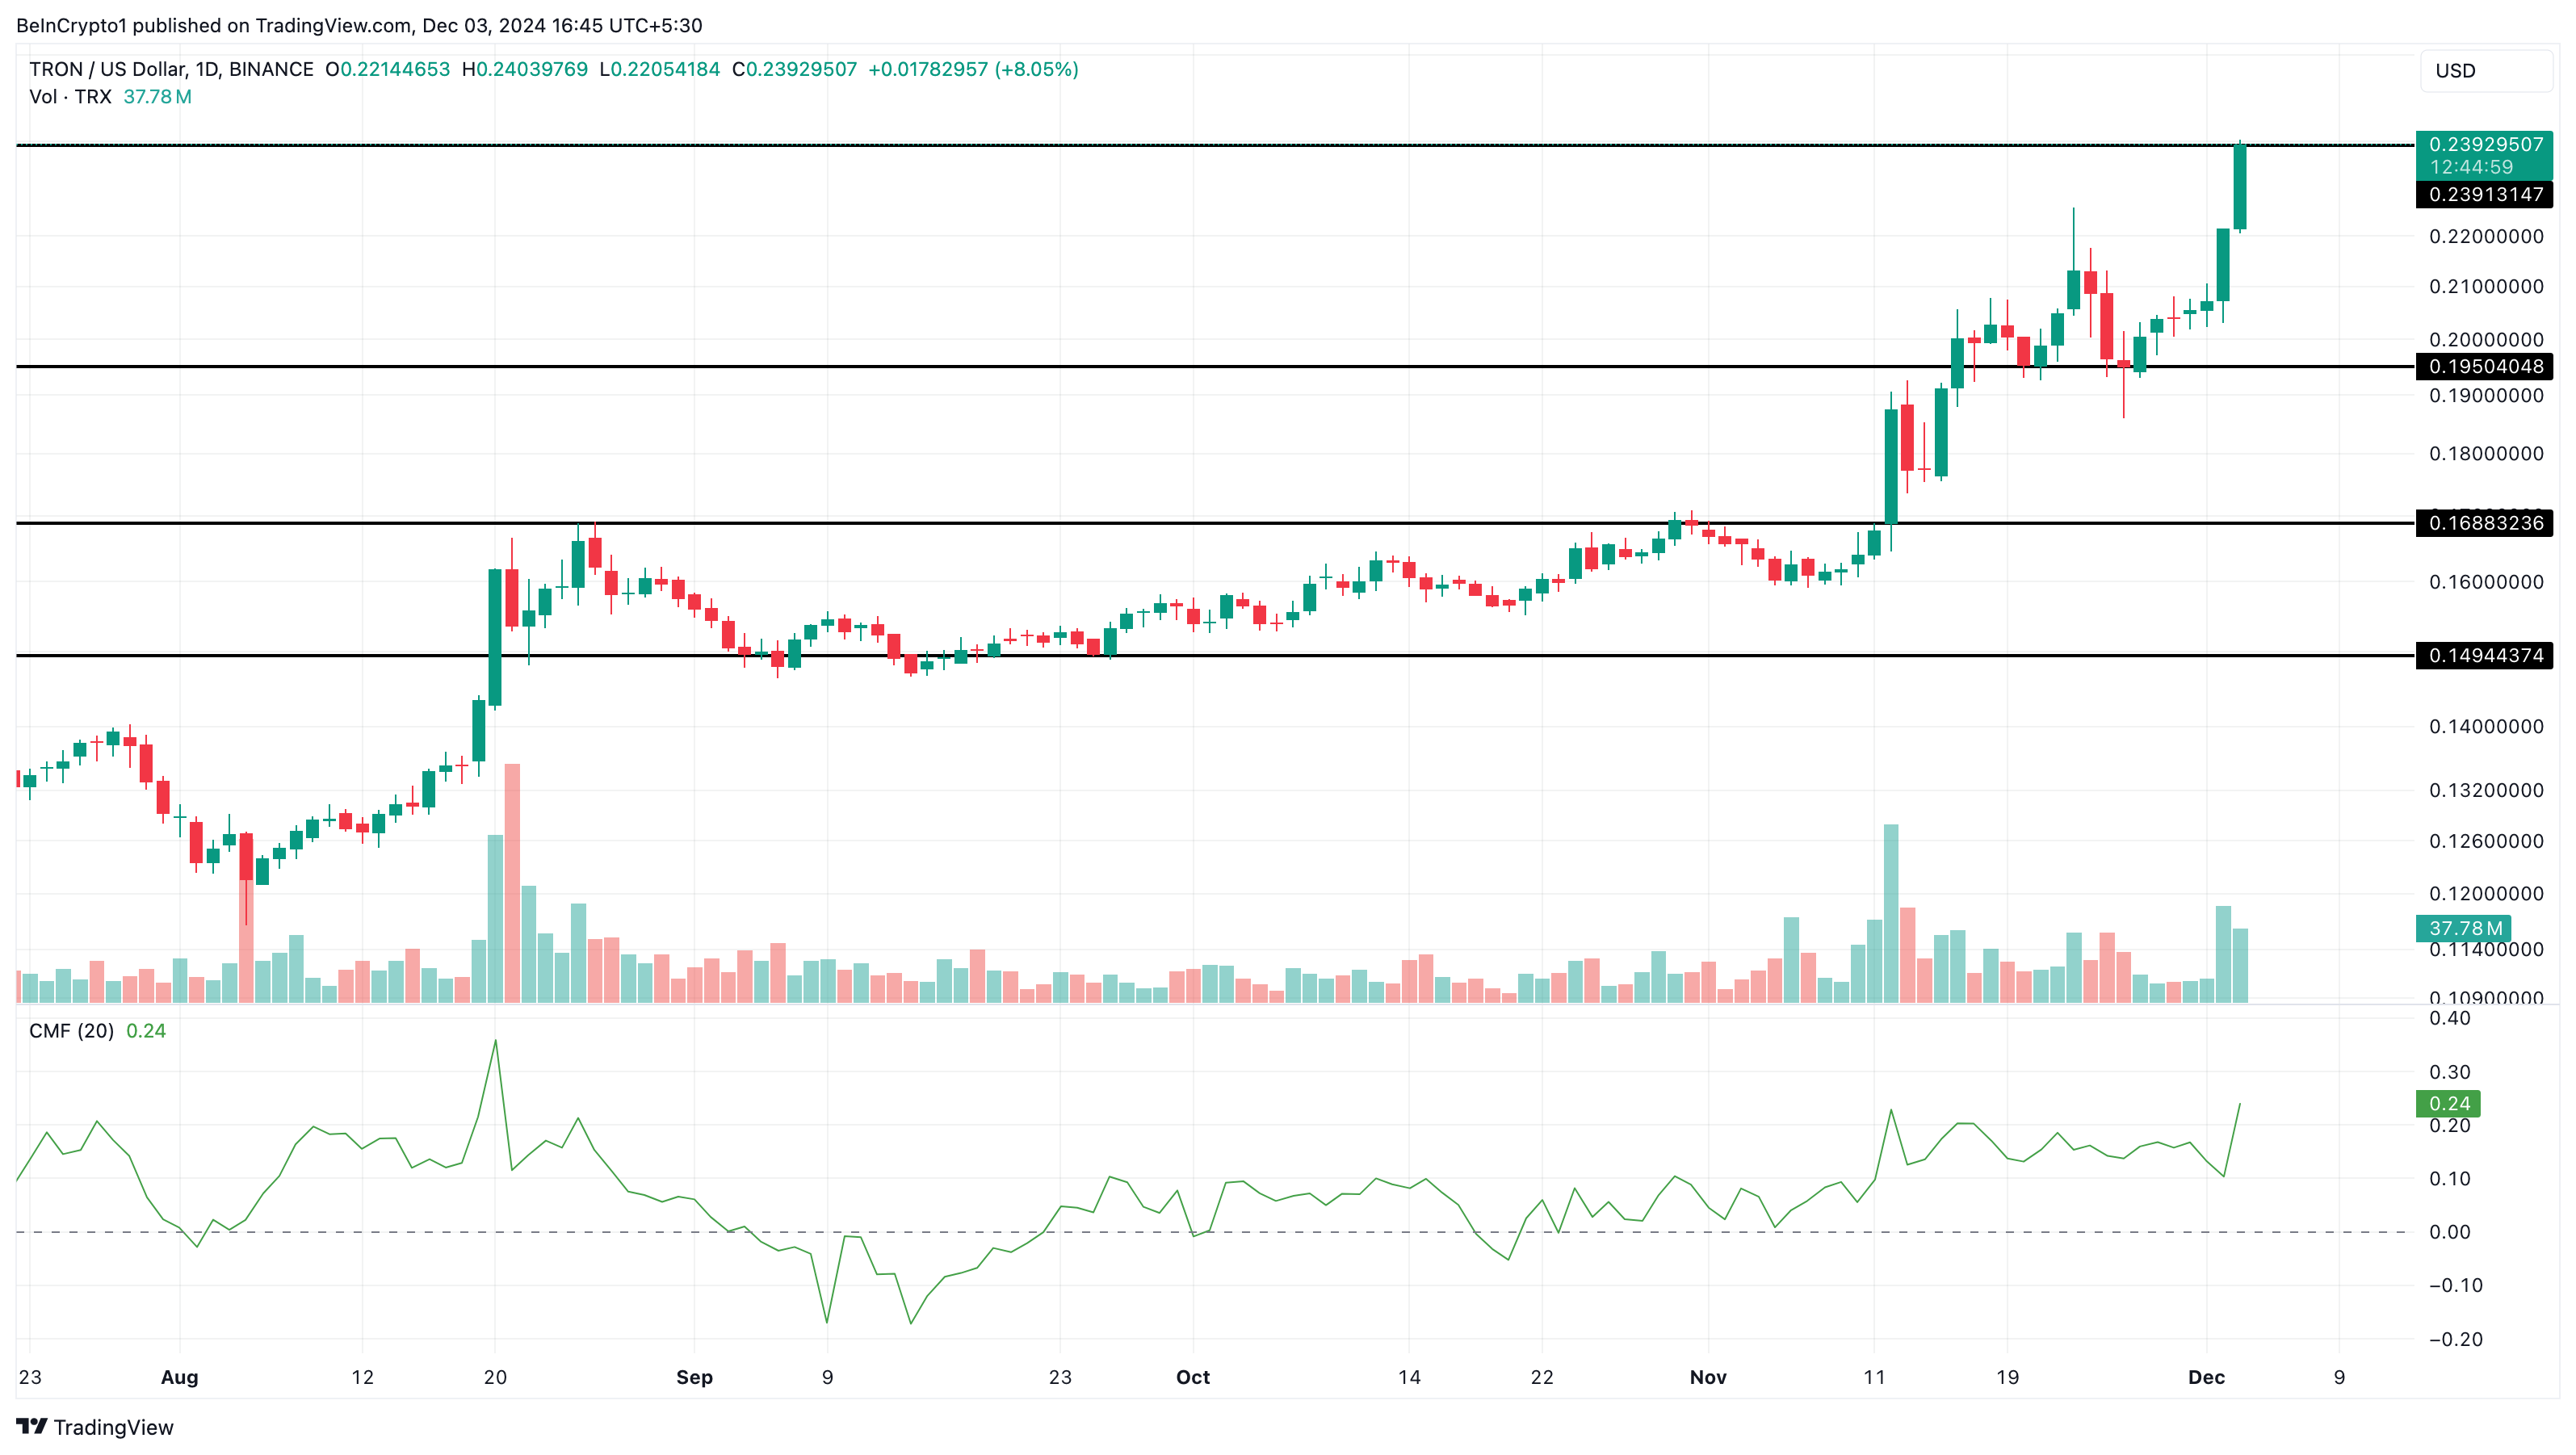 Tron Daily Analysis. Source:
TradingView
Tron Daily Analysis. Source:
TradingView
However, if the CMF drops below the zero level, this prediction might be invalidated. If that happens, TRX could decline to $0.20. In a highly bearish situation, the TRX value could fall to $0.17 or $0.15.
Disclaimer: The content of this article solely reflects the author's opinion and does not represent the platform in any capacity. This article is not intended to serve as a reference for making investment decisions.
You may also like
Bitcoin Eyes Breakout Above Neckline Toward $140K 🧭
Bitcoin charts show a potential breakout above the neckline — could we be headed to $140K+ soon? Insights ahead!Measured Move Targets $140,000sWhat Traders Should WatchTrading Scenario Summary

DOGE Spot Entry Setup: Is This the Bottom?
DOGE looks bottomed with a solid range retest—ideal for building a spot position now.Why it matters🎯 Ideal Risk‑Reward Setup🛠️ Strategic Takeaways

Downside Liquidity Gone: $111K in Sight?
Downside liquidity wiped out—Bitcoin primed for $111K. Are new all-time highs closer than we think?What Does Removing Downside Liquidity Mean?Why $111,000 Could Be NextAre New All-Time Highs Really Sooner Than We Think?

IOTA Recognized by Leading Chinese Analyst Firm AskCI Alongside Microsoft and Amazon
