Solana (SOL) Price Pattern Points to Brief Dip, $260 Target Next

Solana's rally faces resistance with bearish technical patterns pointing to a pullback. Could SOL defy the trend and break $260?
Solana’s (SOL) price has formed a rising wedge on the 4-hour chart, suggesting that the altcoin’s value could face a setback before its potential rise toward $260. At press time, SOL’s value is $237.88, representing a 15% hike in the last seven days.
While SOL holders would expect the rally to continue, several technical indicators suggest that they might need to wait a little longer.
Solana Uptrend Pulls Back
On the 4-hour chart, BeInCrypto observed that a Solana rising wedge pattern has appeared. A rising wedge is a technical pattern commonly seen as a bearish signal, suggesting a potential reversal of an uptrend.
Two converging trendlines define the pattern. Here, the lower trendline (support) rises more steeply than the upper trendline (resistance), forming a narrowing channel. When the price breaks below the lower trendline, it confirms the bearish reversal, indicating a potential decline.
However, in some cases, a breakout to the upside can occur, though it is less common. In SOL’s case, it appears that the price is on the cusp of breaking below the lower trendline. Once validated, this could halt the altcoin’s rally, and a notable downturn could be next.
 Solana Rising Wedge. Source:
TradingView
Solana Rising Wedge. Source:
TradingView
Furthermore, the Money Flow Index (MFI) adds weight to this bearish outlook. Notably, the MFI is a technical indicator that uses price and volume to measure the capital flowing in and out of a cryptocurrency.
A rising MFI indicates strong buying pressure, while a decline highlights sellers’ dominance. Currently, the MFI shows a downward trend, amplifying the bearish sentiment. When paired with the emerging rising wedge pattern, this confluence of signals reinforces the case for a potential decline in Solana’s price.
 Solana Money Flow Index. Source:
TradingView
Solana Money Flow Index. Source:
TradingView
SOL Price Prediction: $205 Before $260?
On the daily chart, Solana’s price faced resistance at $239.56 as it attempted to climb toward $260. Due to this development, SOL might not find it easy to hit its all-time high in the short-term
The Fibonacci retracement indicator also supports this prediction. For context, the Fib indicator shows a sequence that generates a pattern of steadily increasing numbers that converge toward the price levels where a cryptocurrency might reach
 Solana Daily Analysis. Source:
TradingView
Solana Daily Analysis. Source:
TradingView
A key one is the 23.6% Fib level, which shows a potential pullback point. Considering the Solana rising wedge and lack of buying pressure, the altcoin’s price could decline to $205.12.
However, if SOL breaks above the upper trendline of the rising wedge, this might not happen. Instead, the token could rise above $260 and hit a new all-time high.
Disclaimer: The content of this article solely reflects the author's opinion and does not represent the platform in any capacity. This article is not intended to serve as a reference for making investment decisions.
You may also like
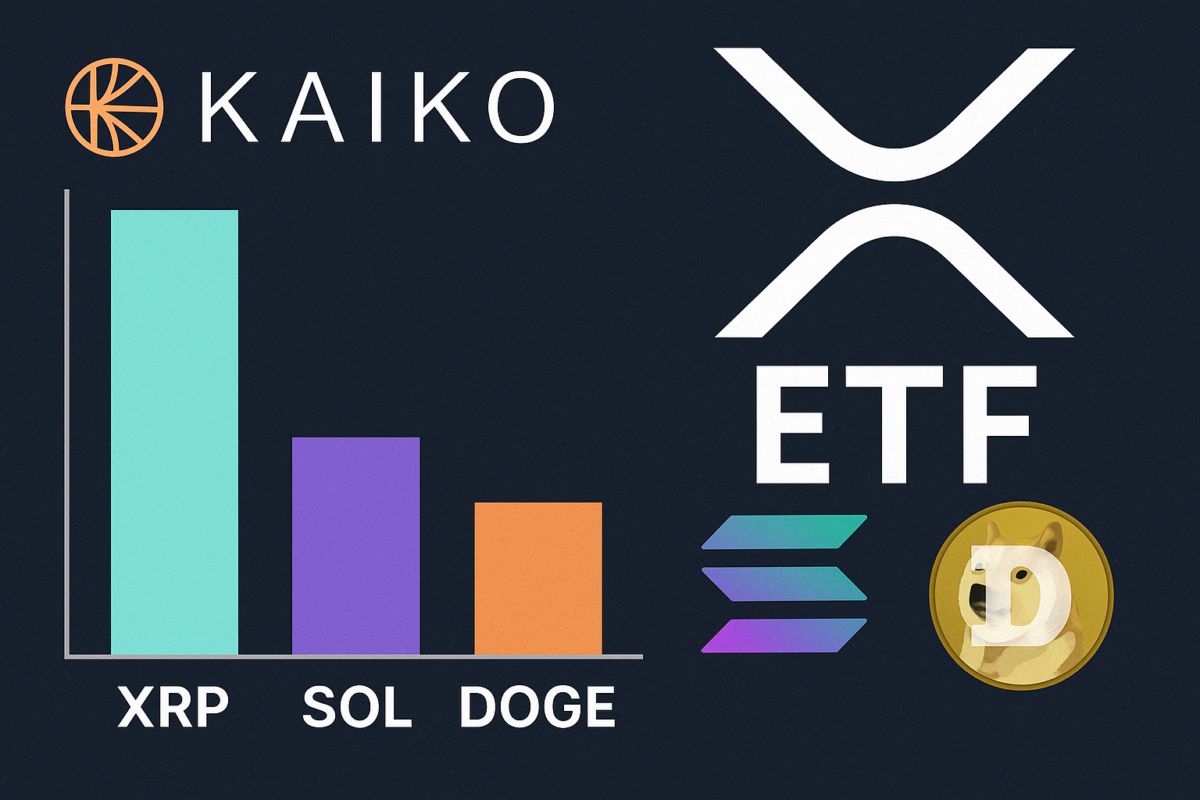
XRP Gains Edge in ETF Race Over SOL and DOGE, Says Kaiko
Strive Pushes Intuit to Add Bitcoin to Treasury
Strive urges Intuit to hold Bitcoin in its treasury to hedge against AI-driven disruption risks.Bitcoin as a Hedge Against AI Disruption?Why Bitcoin, and Why Now?BTC in the Boardroom

JP Morgan Predicts Imminent Interest Rate Cuts
JP Morgan forecasts upcoming rate cuts, signaling a major shift in U.S. economic policy that could impact markets and crypto alike.JP Morgan Signals Upcoming Interest Rate CutsWhy Rate Cuts Matter for MarketsCrypto Could See Renewed Interest

Raydium launches Launch Lab, a token issuance platform