Bitcoin Faces a Potential Price Correction: Analyzing the Impact of Recent Market Trends and Indicators

- On-chain data from Santiment indicates a slight drop in Bitcoin’s MVRV ratio, suggesting bearish market sentiment.
- Despite bearish trends, the fear and greed index at 38% suggests potential for an upcoming price rally.
Bitcoin recently surpassed the $66,000 mark, generating significant attention within the cryptocurrency community. However, this upward trend was short-lived as the price dipped below this threshold again. Current data indicates that Bitcoin may be on the cusp of a major price correction.
In the last 24 hours, Bitcoin has undergone a price correction, falling under $66,000. As of this report, Bitcoin is trading at $65,504.34. ETHNews had previously indicated the likelihood of Bitcoin experiencing a price correction.
 Source: Crypto Bullet
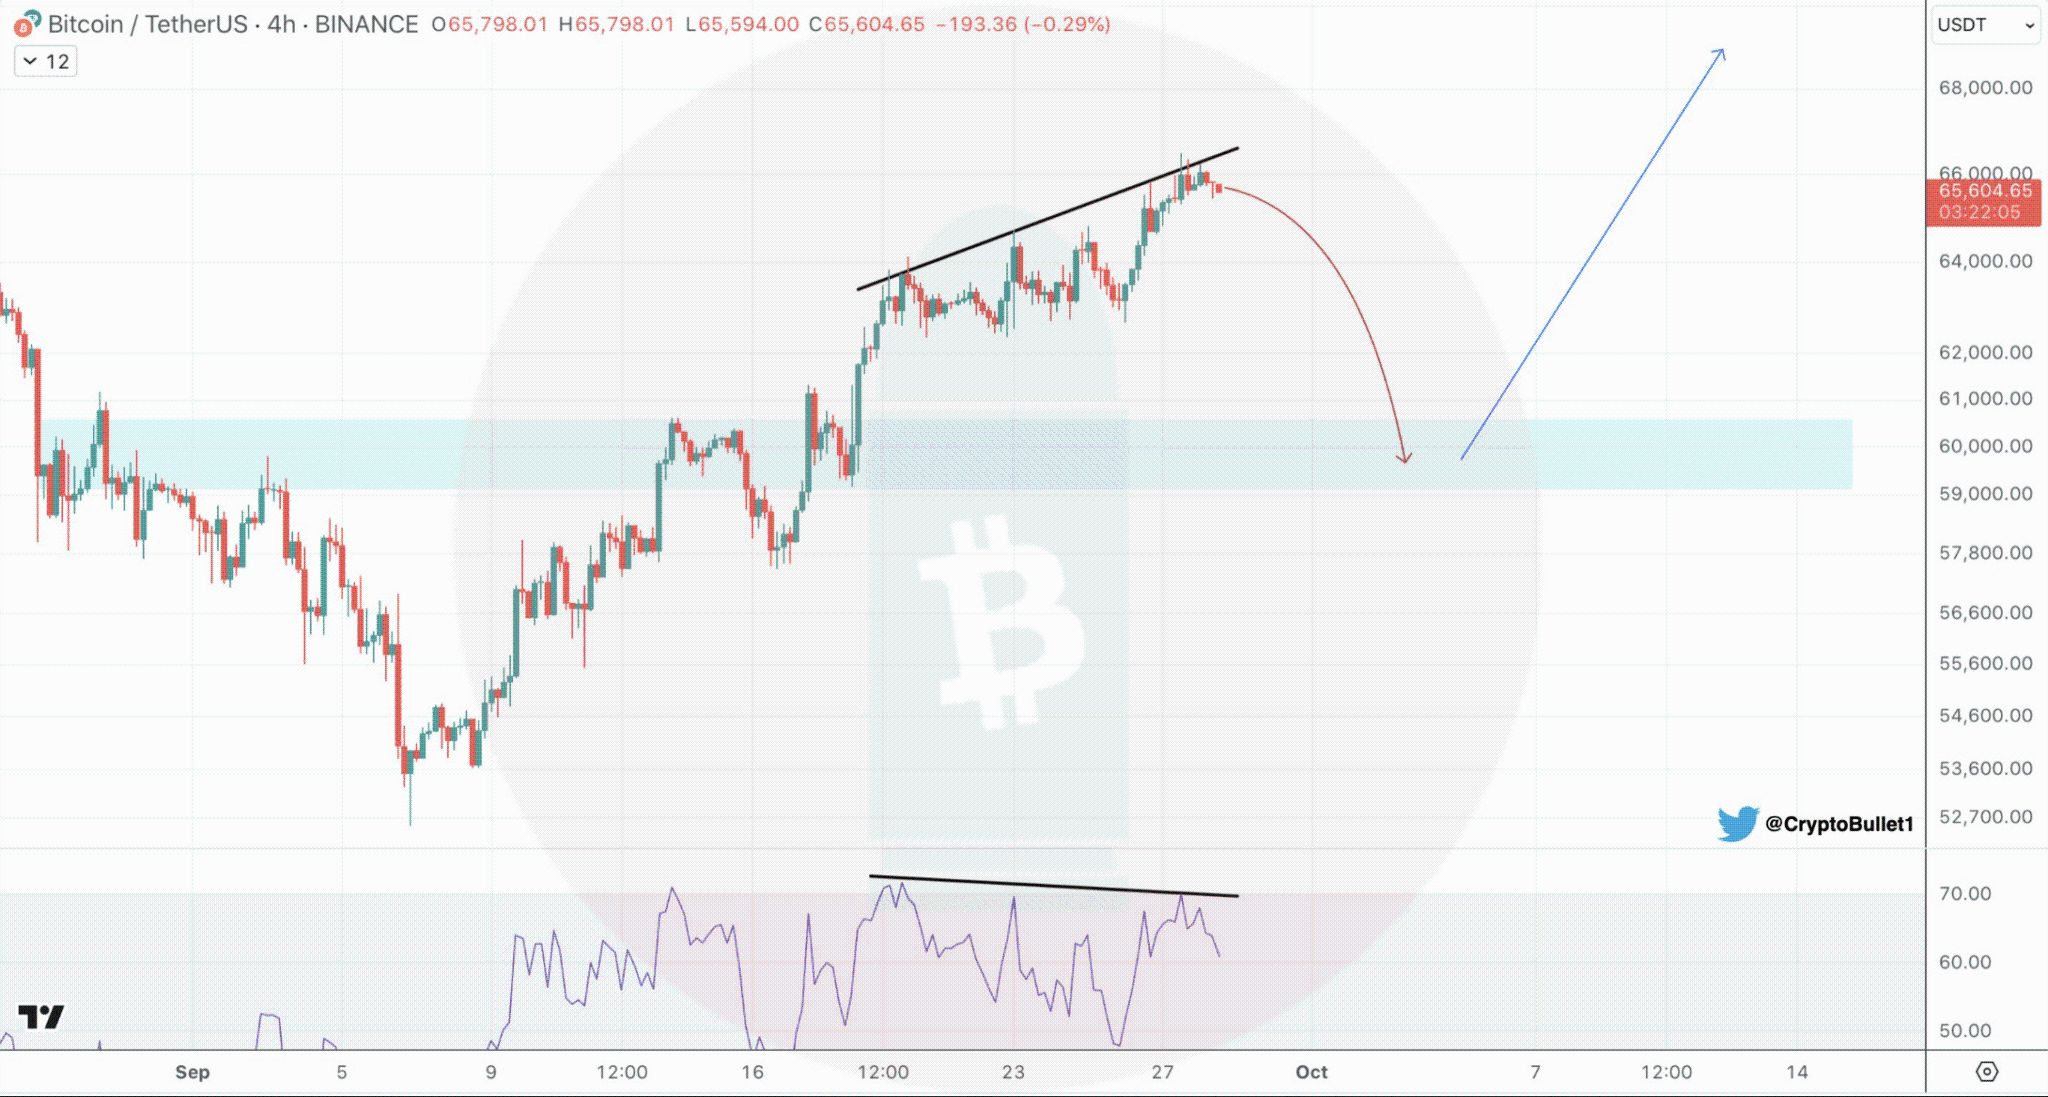
A recent tweet from Crypto Bullet pointed out a bearish divergence on Bitcoin’s 4-hour chart, a classic indicator that often precedes a price drop.
#BTC 4h chart
I think we can get a correction to $59-60k and then continue to rally 📈
That dip would be a great opportunity to buy $Alts if you are still sidelined pic.twitter.com/IoAdvNHrS1
— CryptoBullet (@CryptoBullet1) September 28, 2024
A bearish divergence occurs when price achieves new highs while an oscillator fails to reach a new peak. This divergence suggests that momentum is waning, increasing the likelihood of a price correction. In this scenario, there is a possibility that Bitcoin could retreat to $60,000 if the bearish trend continues.
 Source: Santiment
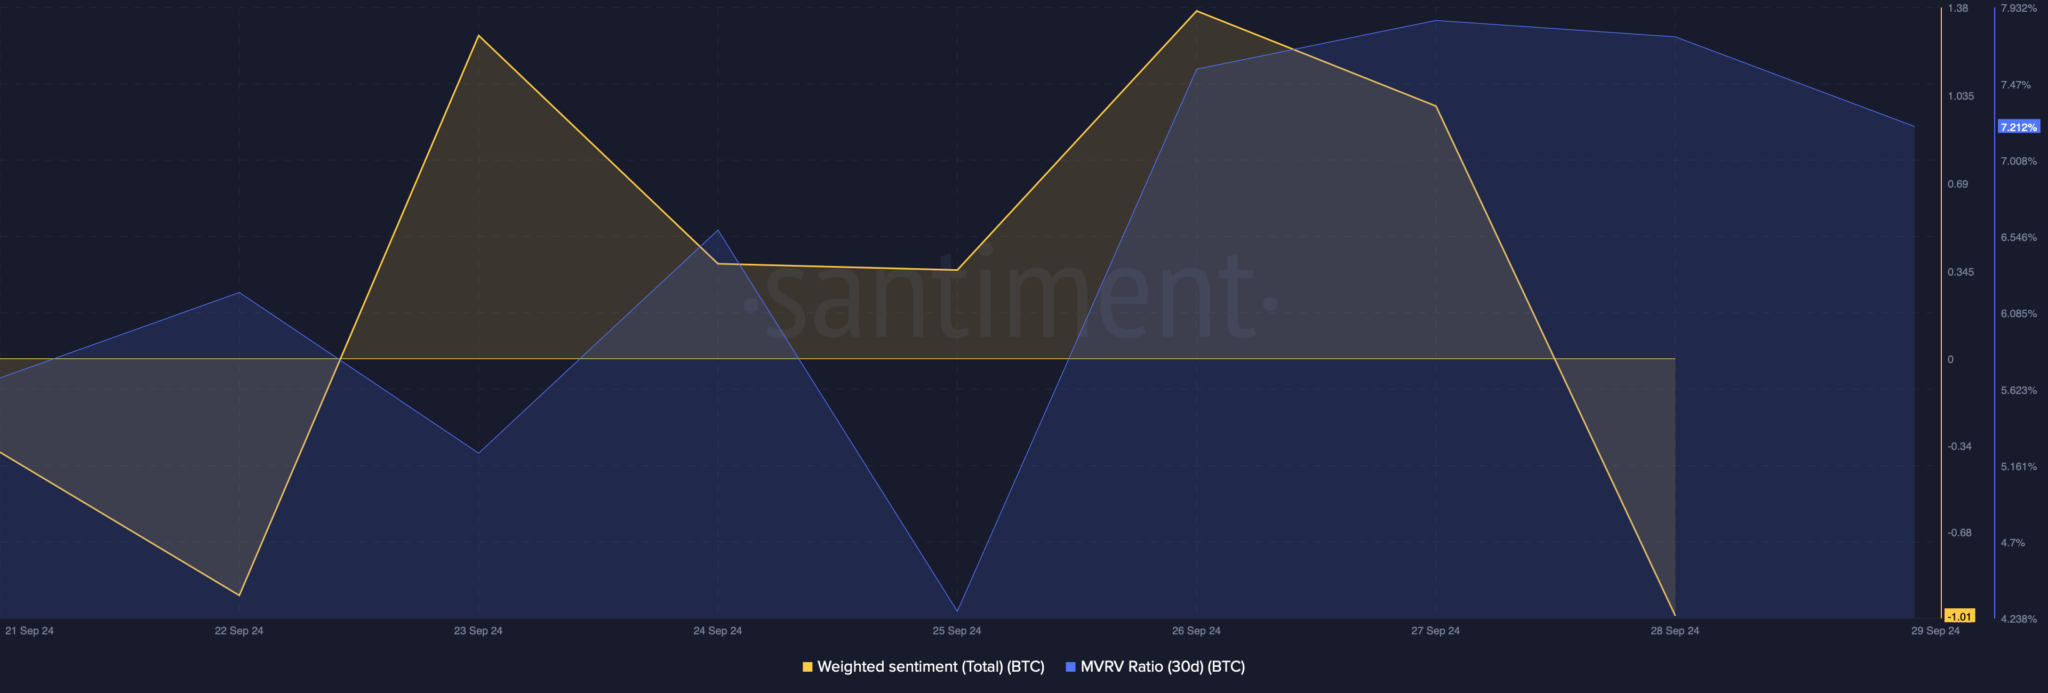
Further analysis from Santiment’s on-chain data supports the bearish outlook, as the MVRV ratio—a measure of market value to realized value—has slightly declined in recent days. This decline is typically interpreted as a bearish signal, implying a potential decrease in Bitcoin’s price.
Additionally, the weighted sentiment around Bitcoin has also turned bearish, further suggesting a potential decline.
ETHNews review of Coinglass’ data revealed another bearish indicator, noting that Bitcoin’s long/short ratio has fallen. This change indicates an increase in short positions relative to long positions, further suggesting that market sentiment is leaning toward a bearish phase.
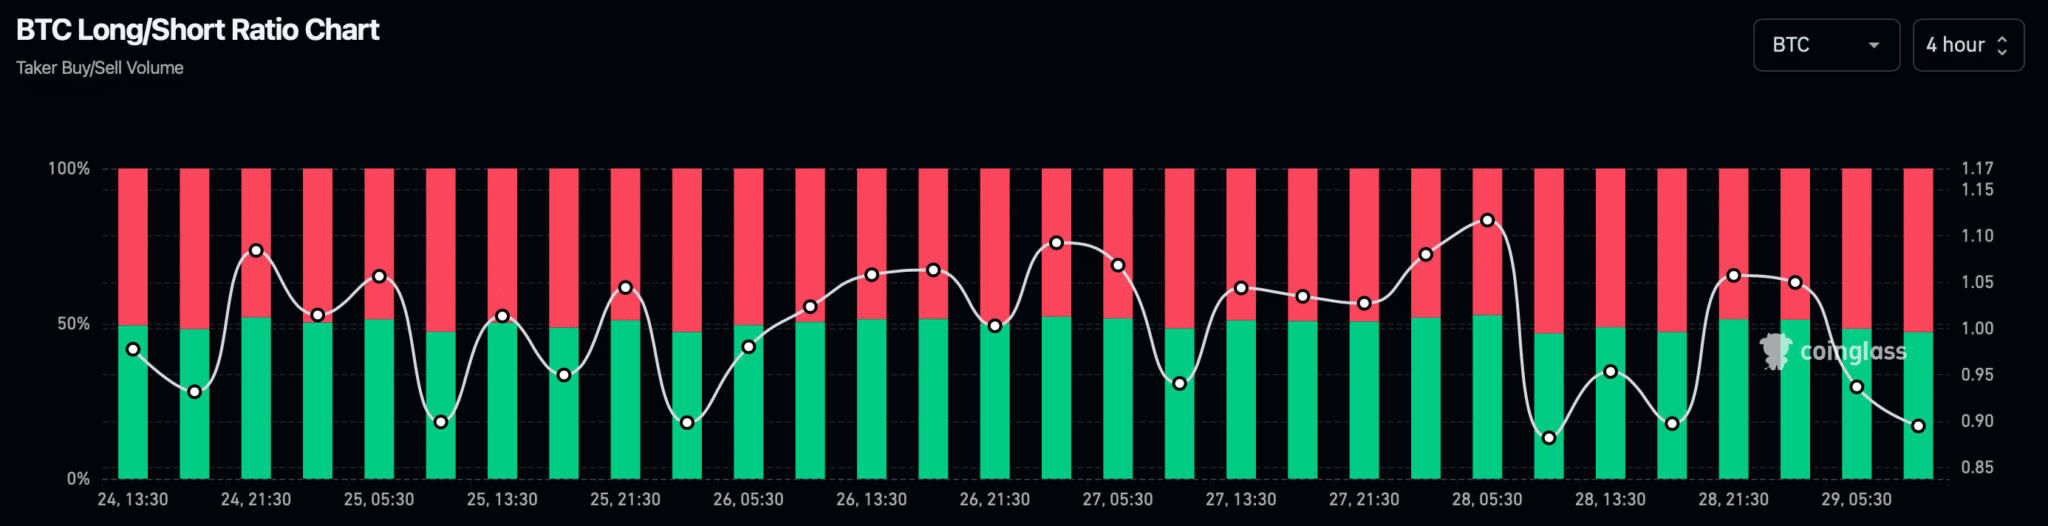 Source: Coinglass
Despite these bearish indicators, not all signals predict a downturn. The fear and greed index currently stands at 38%, placing the market in a “fear” phase. This sentiment can often precede a market rally, as contrarian investors might see it as an opportune moment to buy.
Moreover, on the daily chart, the 9-day moving average remains above the 21-day moving average, which could indicate underlying bullish momentum.
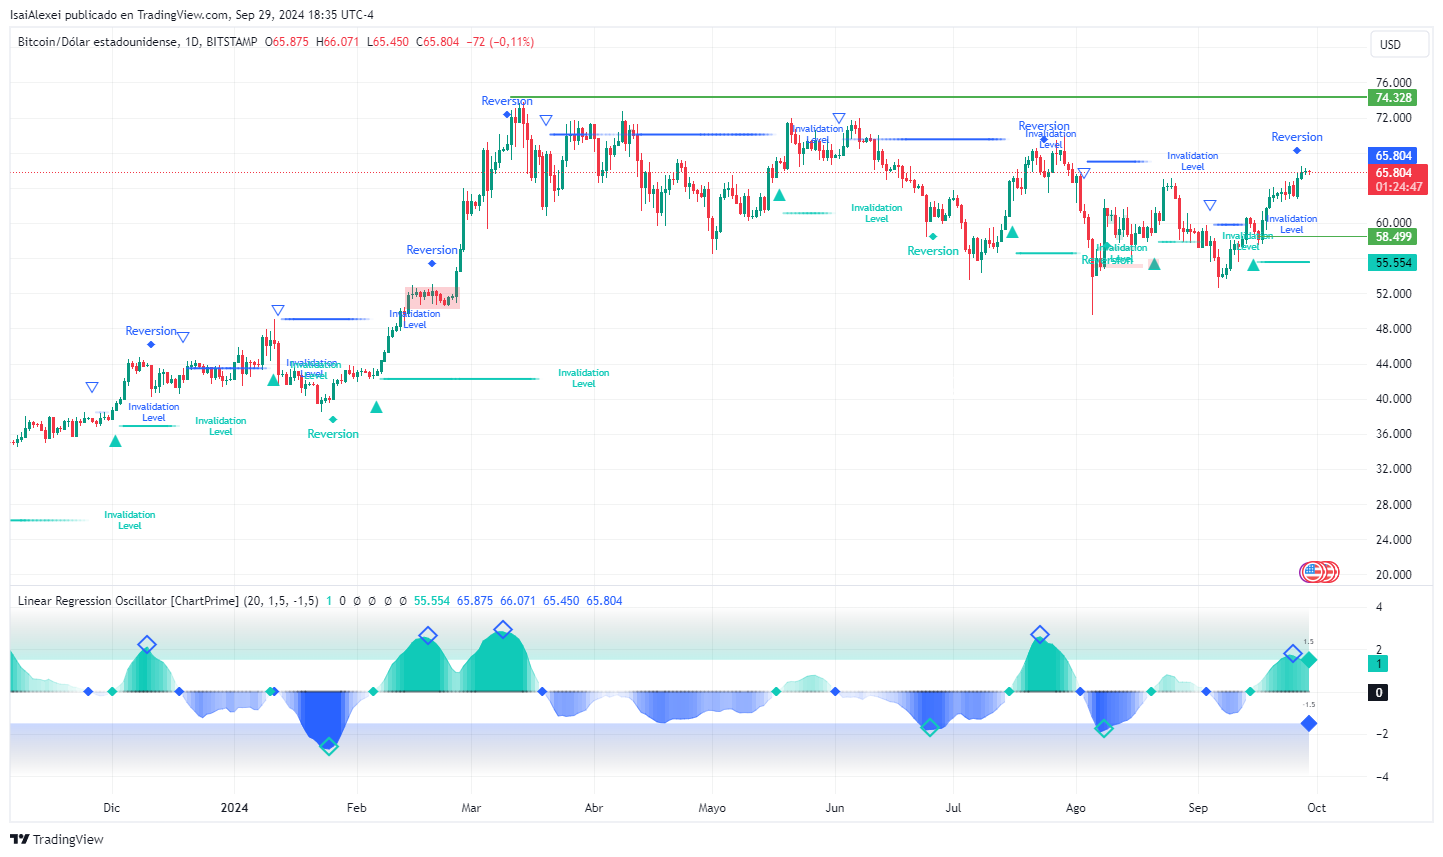 Source: Tradingview
If the bullish signals hold, Bitcoin’s price might aim for the $68,000 mark before any potential fallback to $60,000. This interplay of bearish and bullish indicators illustrates the current volatility and unpredictability of the Bitcoin market , requiring investors to stay particularly vigilant.
Disclaimer: The content of this article solely reflects the author's opinion and does not represent the platform in any capacity. This article is not intended to serve as a reference for making investment decisions.
You may also like
US stocks retreat from session highs as China trade deal remains uncertain
President Trump’s comments that he will not look to fire Fed Chair Jerome Powell sent stocks higher in after-hours trading Tuesday
Is BTC in ‘up only’ mode after rising above $94K?
“Bitcoin does not require a strong equity rally to move higher,” YouHodler markets chief Ruslan Lienkha said
Revenue diversity fuels analyst’s latest COIN ‘buy’ rating
Why an analyst is kicking off COIN coverage with “buy” rating
Bitcoin Rises 6.5%: Potential Catalysts for Future surge Amid Decreasing Demand
Exploring How Stablecoin Demand Could Ignite Bitcoin's Next Surge Amid Market Uncertainties