Bitcoin Price Analysis: Is $64K Next for BTC or is a Crash Toward $56K More Likely?

Since March, Bitcoin’s price has been consolidating in a wide range and gradually declining. This rangebound movement might eventually lead to a long-term bullish trend.
Technical Analysis
By TradingRage
The Daily Chart
On the daily chart, the price has recently broken below the 200-day moving average, located around the $63K mark.
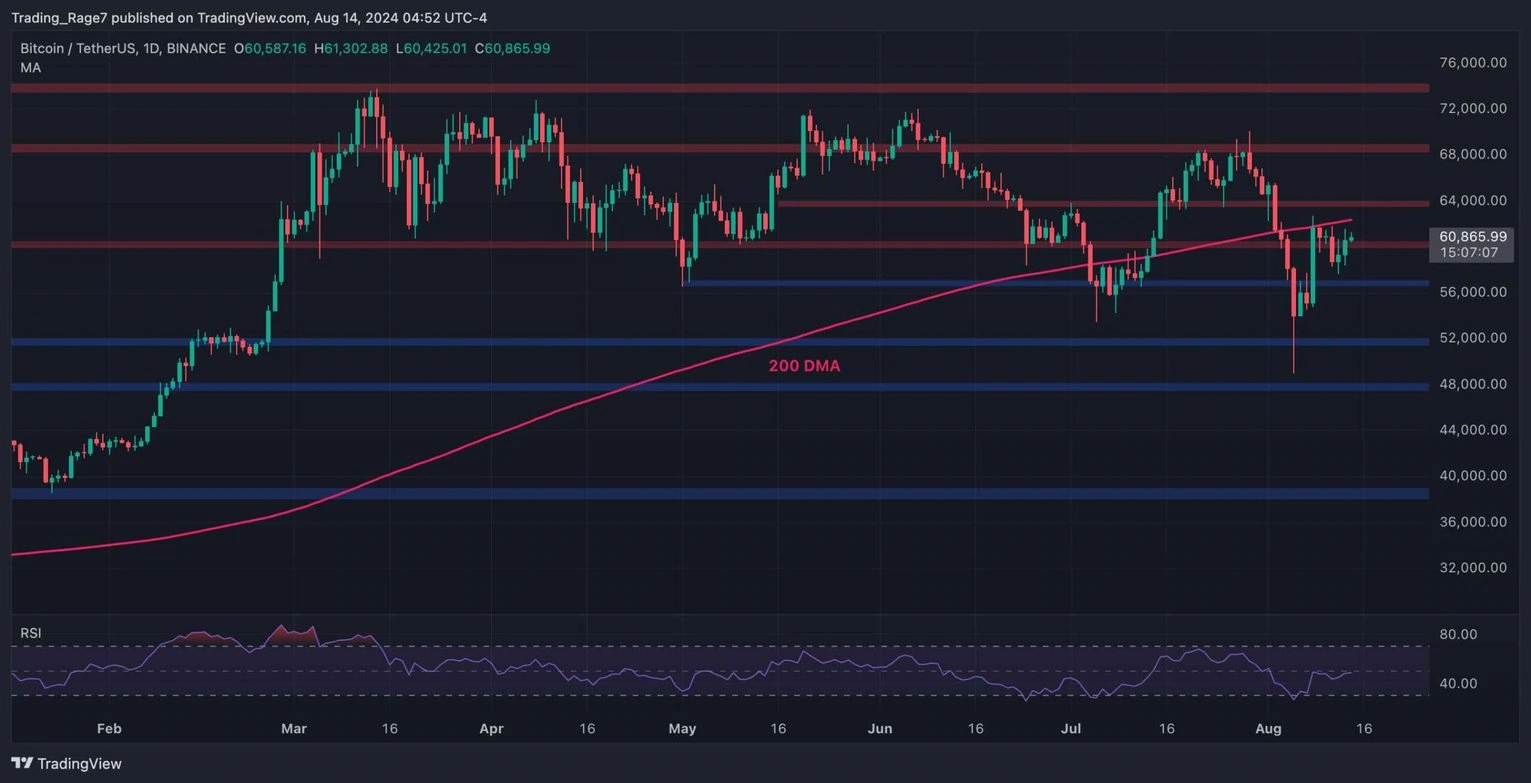
Yet, the market has rebounded from $50K and has retested the 200-day moving average but has been rejected to the downside.
Currently, the price is likely to test $56K. If the level holds, the market could once again rally toward the 200-day moving average and probably higher, which could lead to the beginning of a new bull run.
The 4-Hour Chart
The 4-hour timeframe demonstrates a possible recovery scenario, as the price has rapidly bounced higher from the $52K support level following last week’s drop.
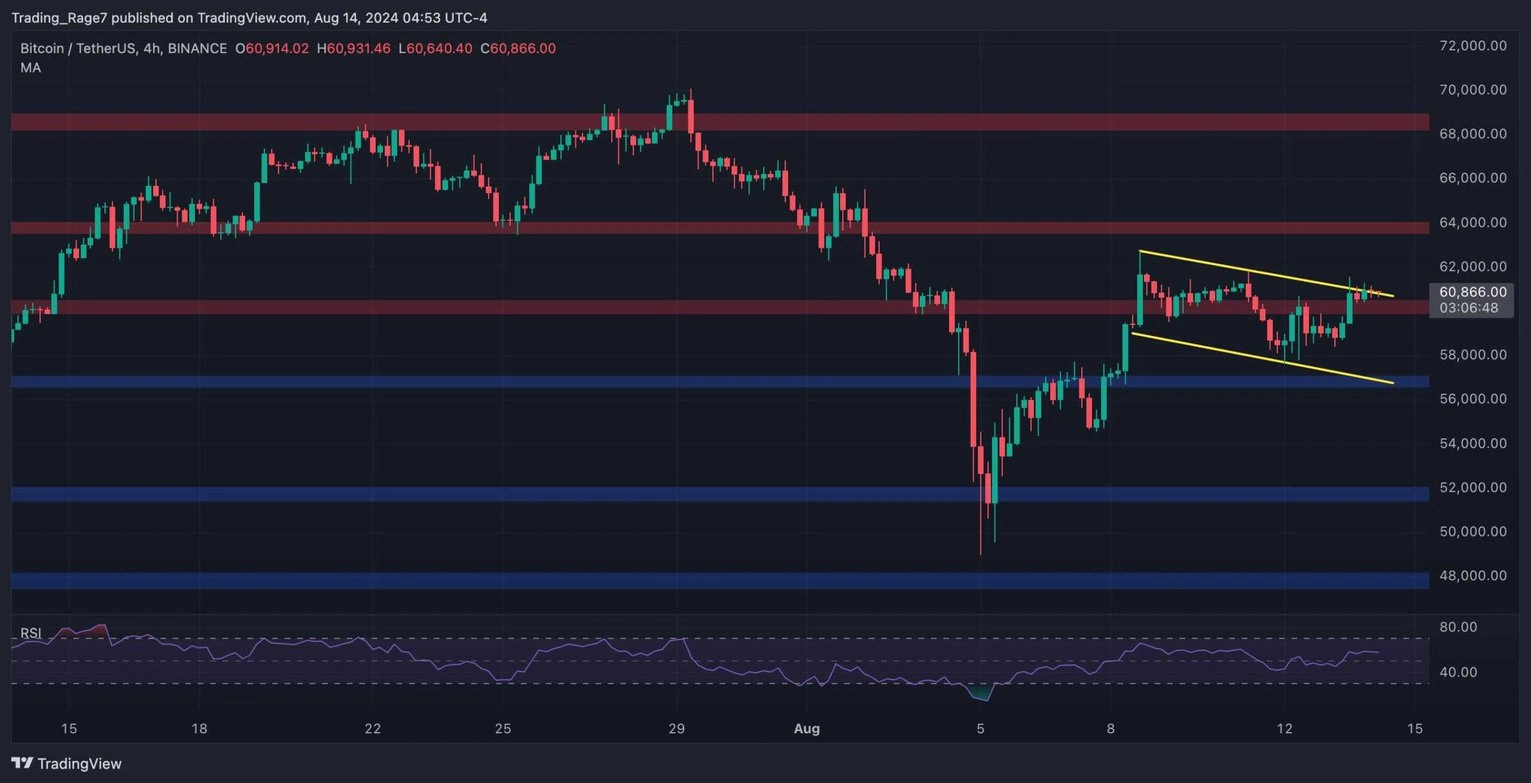
Yet, the market is struggling to break above the $61K resistance level at the moment and is creating a bullish flag pattern.
If it’s broken to the upside, an upward move toward the $64K level would be highly likely in the short term. On the other hand, if the pattern fails, things could quickly get worse, and the market could decline to the $52K level once more.
On-Chain Analysis
By TradingRage
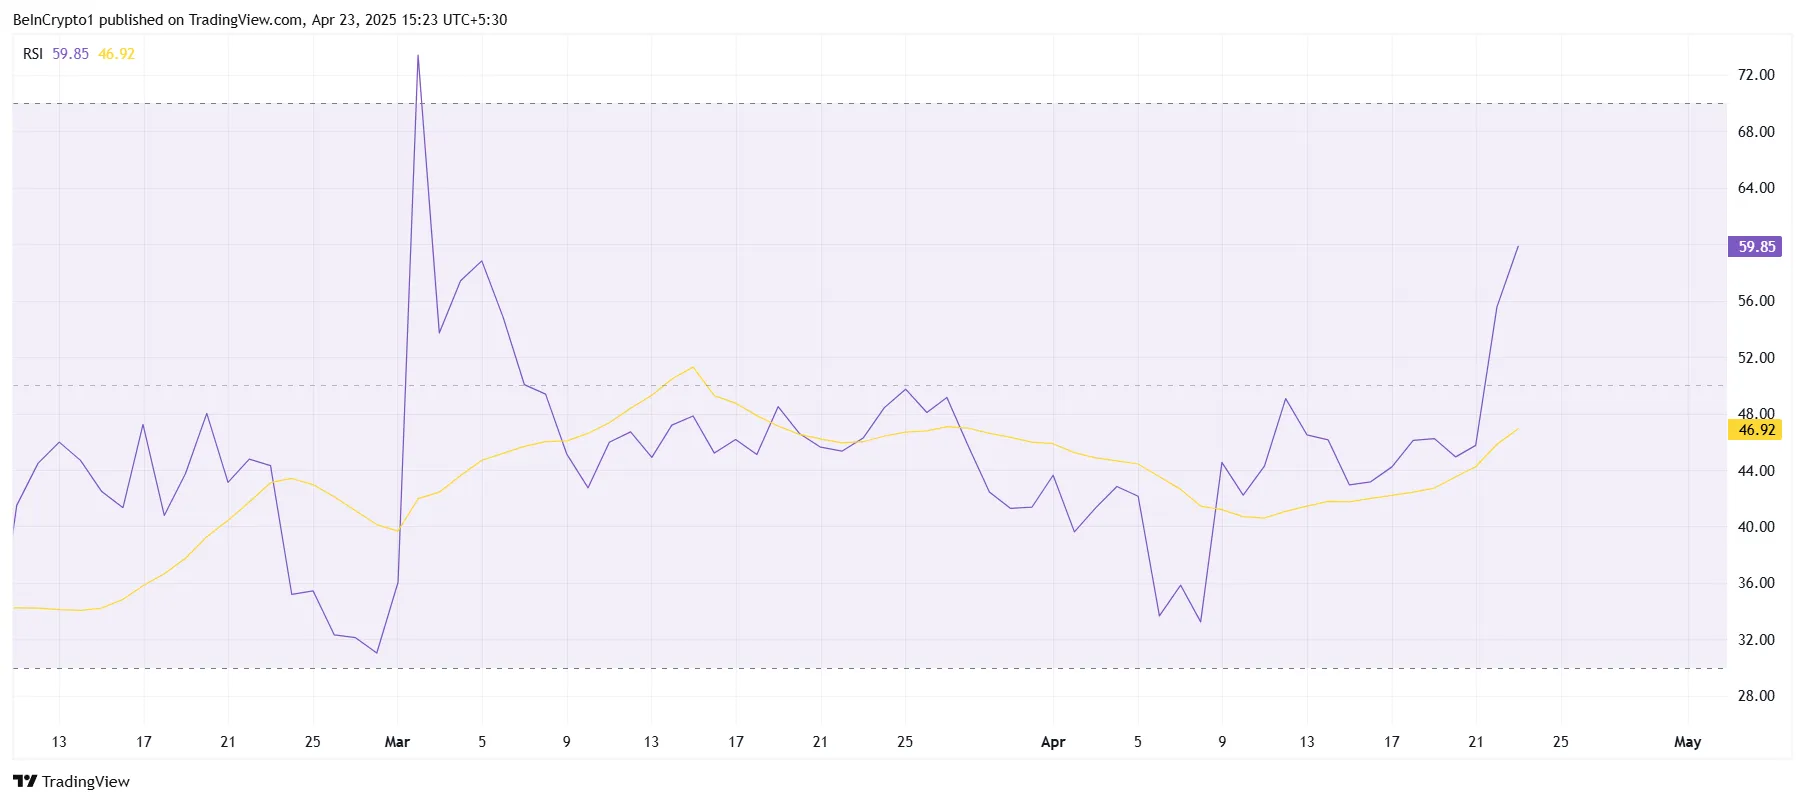
Bitcoin Exchange Reserve
While Bitcoin’s price action is not convincing, some fundamental network metrics, due to a considerable decline in supply, are pointing to a potential price rally in the coming months.
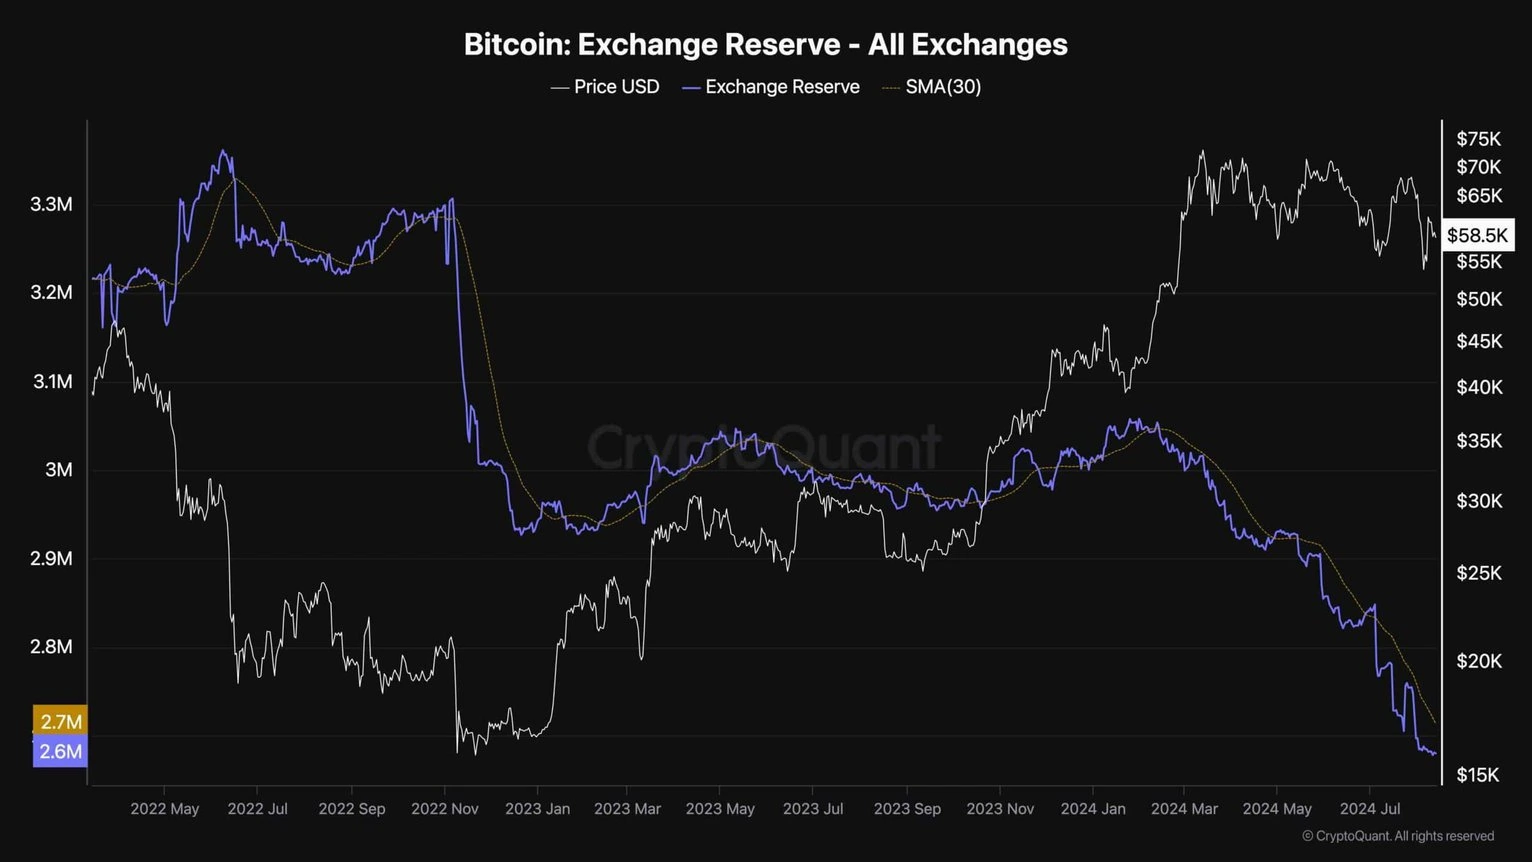
This chart displays the Bitcoin exchange reserve metric and its 30-day moving average. The metric measures the amount of BTC held in exchange wallets. The number of these coins can be considered a proxy for supply, as they are readily held on exchanges and can be sold quickly.
As the chart suggests, however, the exchange reserve metric has been on a steep decline since the beginning of 2024, indicating an aggregate accumulation behavior by investors. This is a good sign and can lead to a supply shock in the near future, which could result in a price surge for BTC.
Disclaimer: The content of this article solely reflects the author's opinion and does not represent the platform in any capacity. This article is not intended to serve as a reference for making investment decisions.
You may also like
Cardano Surges 17%, Eyes Potential $5 Target

Cardano’s Price Recovery Suggests Potential Bullish Trend But Risks Remain Below $0.70
Bitcoin: Crucial Metric Signals Bullish Momentum
Bitcoin Price Faces Crucial $97K Resistance, Glassnode On-Chain Data Reveals