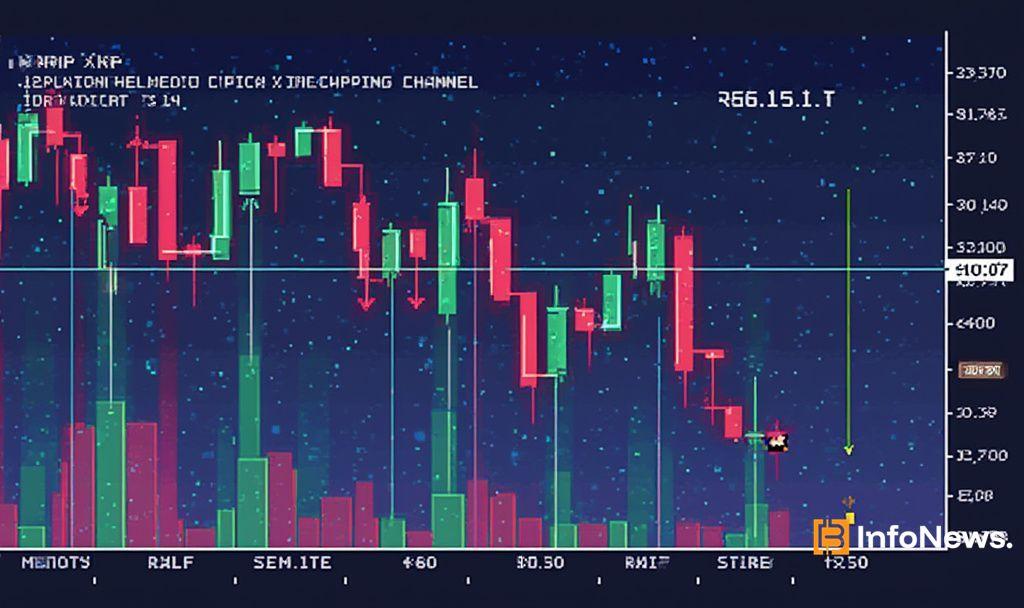
Bitcoin bear trap over? BTC price fractal hints at parabolic move next

Crypto market analysts say the Bitcoin ( BTC ) bear trap is officially over. Based on historical chart patterns, they are eyeing the next price breakout.
Was the 25% Bitcoin price drawdown a bear trap?
A bear trap is a form of coordinated but controlled selling that creates a temporary dip in an asset’s price. It typically comprises a significant correction during a long-term uptrend.
The latest correction may have been a bear trap or a shake-out, according to pseudonymous crypto analyst Sensei, who wrote in an Aug. 8 X post:
“So, that was a shake-out or a Bear trap?”
Moreover, Bitcoin fractals point to the imminent start of Bitcoin’s parabolic phase, noted the pseudonymous analyst Sensei in an Aug. 6 X post.
Fractal patterns are used by technical traders to identify key support and resistance levels and potential trend reversals based on historical data.
Related: Solana hits new all-time high against Ethereum, but is $200 SOL price within reach?
Despite fractal patterns signaling a local bottom, Bitcoin’s daily trend could still turn negative, according to Aurelie Barthere, the principal research analyst at Nansen onchain analytics platform.
The analyst told Cointelegraph, sharing the below chart:
"Local bottoms yes, but the daily trend in BTC (and ETH) still looks negative: the 50-day moving average is about to cross below the 200-day moving average (see attachment 1 on BTC, the red line is about to cross below the green line).”
BTC price faces “difficult threshold” at $62K
Bitcoin’s next significant resistance to cross is at $62,000 before a chance to breach $70,000, and tackle the all-time high above, according to Barthere from onchain data analytics platform Nansen.
The analyst told Cointelegraph:
“BTC needs to hold above 62k. The other threshold of resistance is 70k-71k or the all-time high. Psychologically, a few traders have been hurt by the March and July sell-offs and this might be a very difficult threshold to cross.”
Bitcoin faces significant resistance at $61,500 and $62,000. A rally above $62,000 would liquidate $845 million worth of cumulative leveraged short positions, according to Coinglass data .
This article does not contain investment advice or recommendations. Every investment and trading move involves risk, and readers should conduct their own research when making a decision.
Disclaimer: The content of this article solely reflects the author's opinion and does not represent the platform in any capacity. This article is not intended to serve as a reference for making investment decisions.
You may also like
XRP Tests Key Support Amidst Challenging Market Conditions
Ripple vs SEC Case Concludes with Final Appeal Dropped

SEC Drops Appeal, Ends Ripple Lawsuit

Shiba Inu Reports No Activity for 1 Trillion Tokens