👇1-12) Concerns persist due to the overhanging supply and lack of solid
market fundamentals, presenting potential risks for medium-term traders.
👇2-12) Last week,
Bitcoin appeared poised to rebound from oversold levels ahead of the CPI release, which was expected to be lower. However, since this was broadly anticipated and Bitcoin had already rallied, prices couldn't hold. This trend in lower inflation may persist into October when year-on-year comparisons become more challenging.
👇3-12) Bitcoin has weathered the $3 billion
Bitcoin sell-off by the German State of Saxony, though it experienced nearly a 20% correction at its lowest point during these sales. However, a larger sale is anticipated in the coming weeks and months, which could further impact the market, as we explain below.
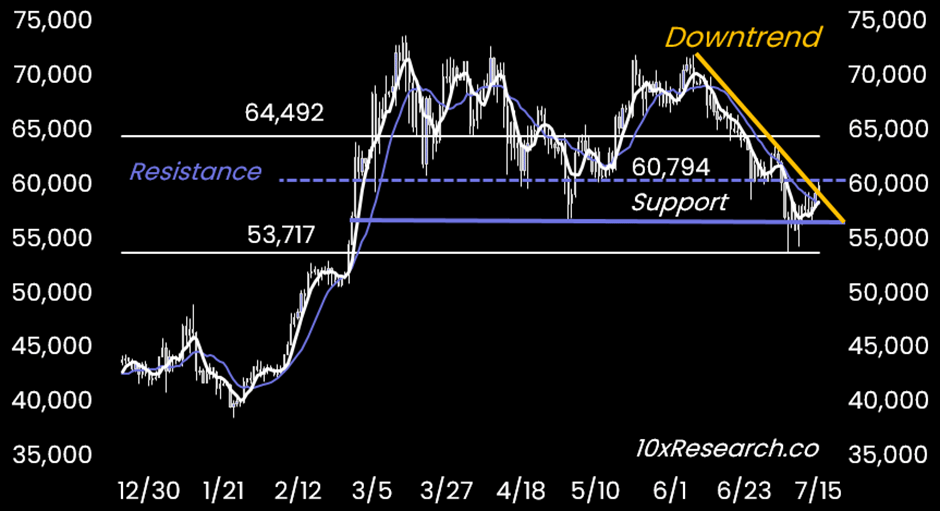
👇4-12) Technically, Bitcoin has found a bottom near its May lows at $56,000, with the downtrend line from mid-June being tested. However, a bearish outlook is warranted if Bitcoin remains below $61,000. The range between $56,000 and $61,000 is considered a "no man's land," following a recent forecast for a decline to $55,000.
👇5-12) Short-term holder supply, defined as addresses holding Bitcoin for less than 155 days, spiked sharply in early 2024 but has stabilized since Bitcoin hit $70,000 in March. At this high point in the cycle, Bitcoin's rise might be limited without an increase in short-term traders.
👇6-12) Historically, Bitcoin averages a +2.7% return in August but typically declines by -4.8% in September, marking a seasonally weak phase. This year, selling pressure from Mt. Gox creditors could further affect prices during this period.
👇7-12) Even if Bitcoin's technically-driven rebound continues briefly, the impending Mt. Gox liquidation could significantly impact the market between August and October. Up to $6 billion of the $9 billion could be sold, potentially influencing market dynamics.
👇8-12) To reverse the medium-term downtrend, Bitcoin must surpass the 21-week moving average ($61,133). This level aligns with the average ETF buyer’s entry price, and the average cost to mine one Bitcoin is a critical milestone for short-term technical traders.
👇9-12) The debate continues about the longevity of this cycle. Technically, momentum has peaked based on various reversal indicators, resembling previous tops in December 2017 and April 2021, hence our cautious view during the last few months when the upside breakout failed.
👇10-12) After $8 billion of liquidity outflows since mid-June, crypto liquidity increased by $3.4 billion last week. Stablecoin minting rose moderately by $500 million, Bitcoin Spot ETFs increased by $1.05 billion, and futures open interest grew by $1.5 billion.
👇11-12) Bitcoin Spot ETF inflows have also resumed, accumulating $15.5 billion, surpassing the previous year-to-date's record. Despite Bitcoin falling below the average ETF entry price of nearly $60,000, dip buyers have emerged, purchasing $407 million of the $810 million mined last month (around 50%). However, as a 30-day moving average, Bitcoin Spot ETF buying remains relatively modest.
👇12-12) At best, Bitcoin's recent rise can be attributed to oversold technical conditions and favourable low CPI prints. However, macroeconomic support remains limited, with two rate cuts already factored in. The US election is still three months away. Short-term traders may dominate the market until additional selling pressure from Mt. Gox emerges in late July/early August. This potential influx of sales could create challenging conditions for Bitcoin traders in the coming weeks.