- TRON outperforms the market with an 8.50% weekly gain, defying bearish trends.
- TRX surpasses Shiba Inu in market cap, now the 11th largest cryptocurrency.
- BitTorrent’s BTT rebounds with a 2.35% daily rise, eyeing resistance at $0.0000009346.
TRON (TRX) has defied the bearish trends plaguing the broader cryptocurrency market, remaining resilient while others falter. This persistence is notable, especially considering the significant Bitcoin sell-off that has impacted the wider market. Over the past week, TRX has emerged as a standout, gaining nearly 8.50%, demonstrating its potential for continued strength.
TRX Performance Amid Market Downturn
TRX was priced at $0.1235 at press time, reflecting a 5% increase over the past week and a 2.24% rise in the last 24 hours. This bullish trend has positively influenced the intraday market cap, now at $10.769 million, marking a 2.23% increase.
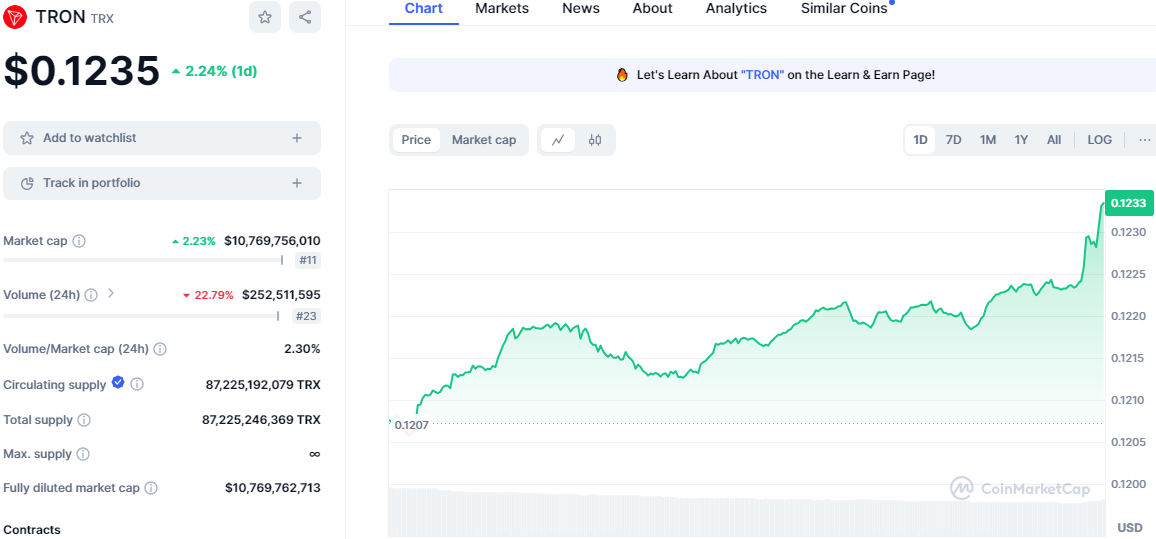
TRX/USD 1-Day Chart (Source: Coinmarketcap )
This surge has allowed TRX to surpass Shiba Inu (SHIB) in market capitalization, positioning it as the 11th largest cryptocurrency by total value. However, TRX’s trading volume tells a different story.
In the past 24 hours, trading volume has decreased by 22.79%, falling to $252.511 million. This decline contrasts with the rising price and market cap, suggesting a cautious approach among traders.
BitTorrent’s BTT Token Market Movement
BitTorrent’s BTT token has experienced a bearish trend throughout the month following its peak of $0.0000012074 on June 5. The token’s price has since dropped by over 26%. However, upon reaching a support level of around $0.0000008261, BTT has rebounded, mirroring the bullish sentiment seen with TRX, its parent company’s token.
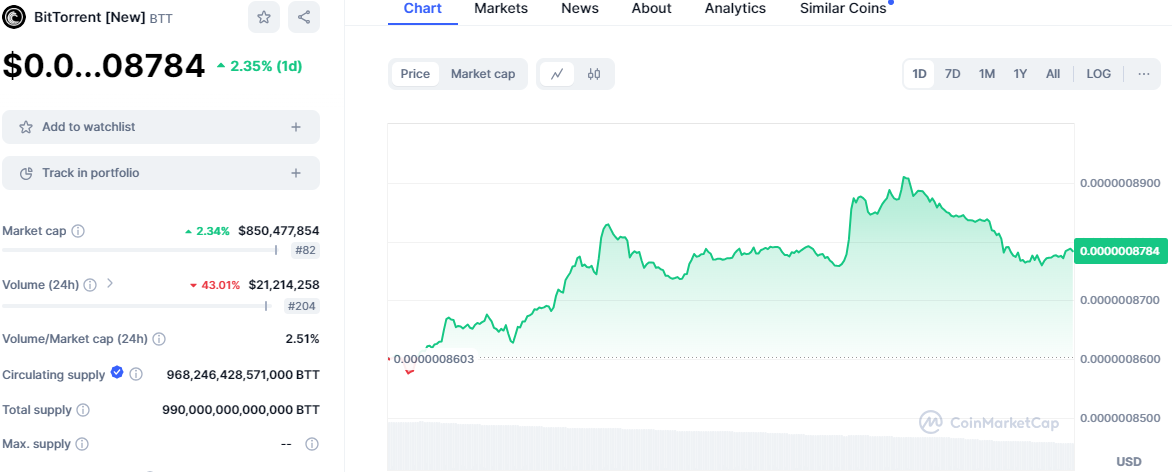
BTT/USD 1-Day Chart (Source: Coinmarketcap )
As of press time, BTT is trading at $0.0000008784, a 2.35% increase from the previous day and a 1.19% rise over the past week. This positions BTT in the 82nd rank by market capitalization, which has also increased by 2.34% to $850,477,854.
Should the bullish momentum persist, BTT is expected to test its immediate resistance level at $0.0000009346, last observed on June 24.
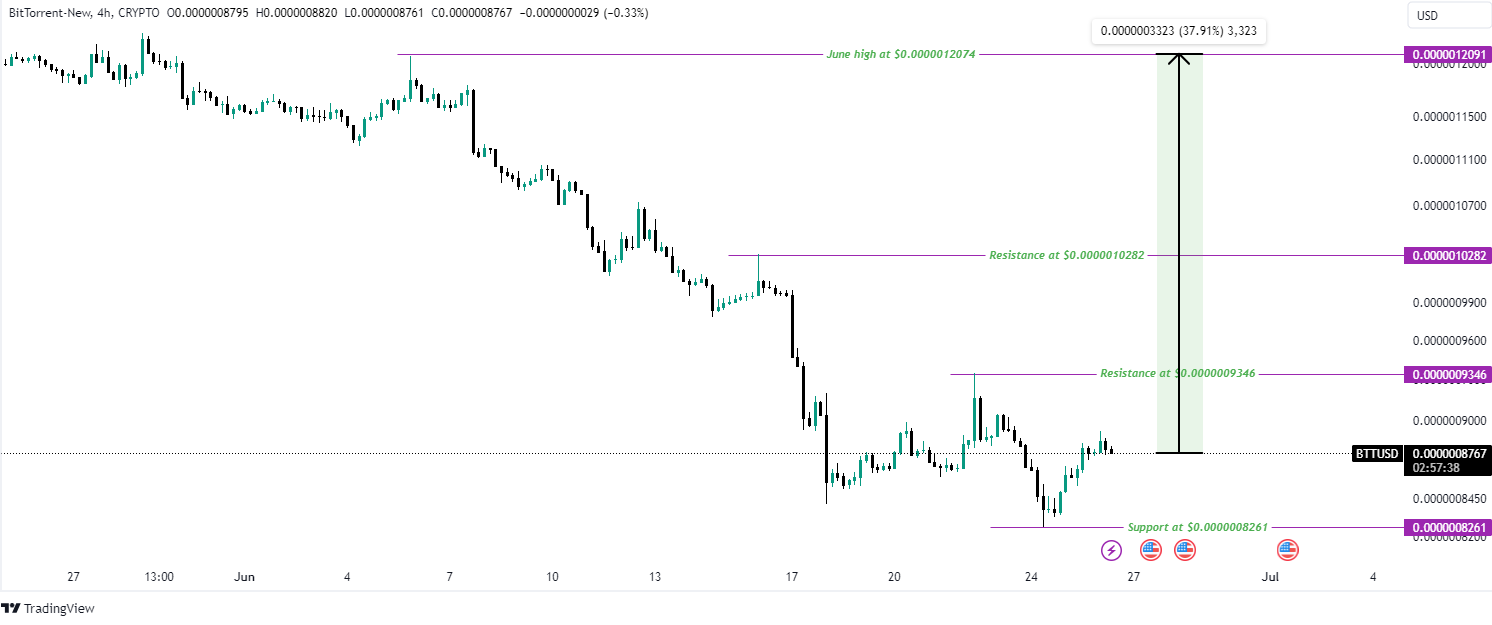
BTT/USD 4-Hour Chart (Source: Tradingview )
A breakthrough at this level could signal a robust bullish sentiment, potentially driving the price to $0.0000010282. Achieving this resistance level could mark a significant 37.91% increase from its current price, bringing it closer to its June high.
JUST’s JST Token Shows Bullish Mood
Similarly, JUST’s JST token shows solid bullish momentum, trading at $0.02894 with a notable 4.62% increase over the past 24 hours. Positioned at 181st in market rank, its market cap has also surged by 4.62% to reach $286.511 million.
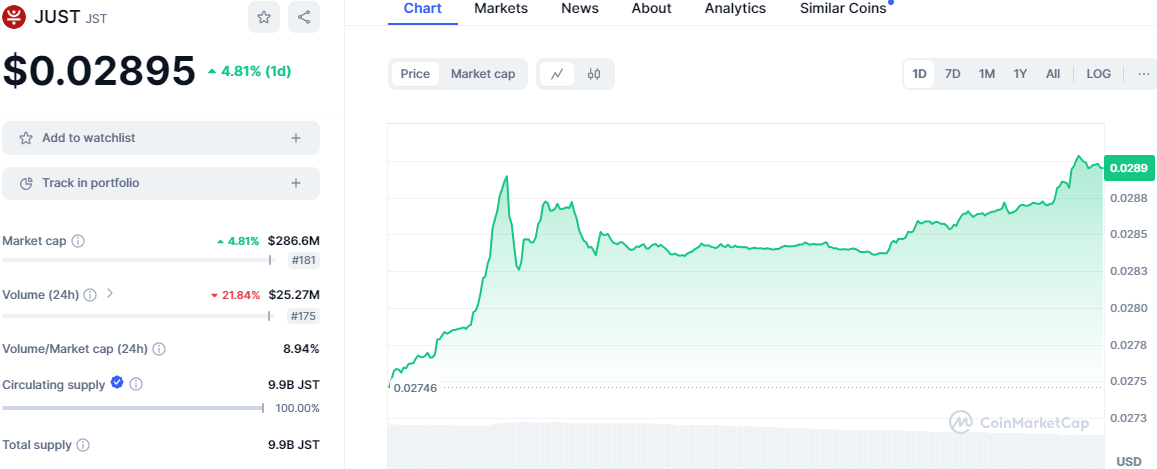
JST/USD 1-Day Chart (Source: Coinmarketcap )
In tandem, TradingView data shows JST is nearing a critical resistance level at $0.0300. If it breaks through this threshold, a surge towards June’s peak of $0.03106 is on the horizon, indicating a potential 7.46% gain from its current position.
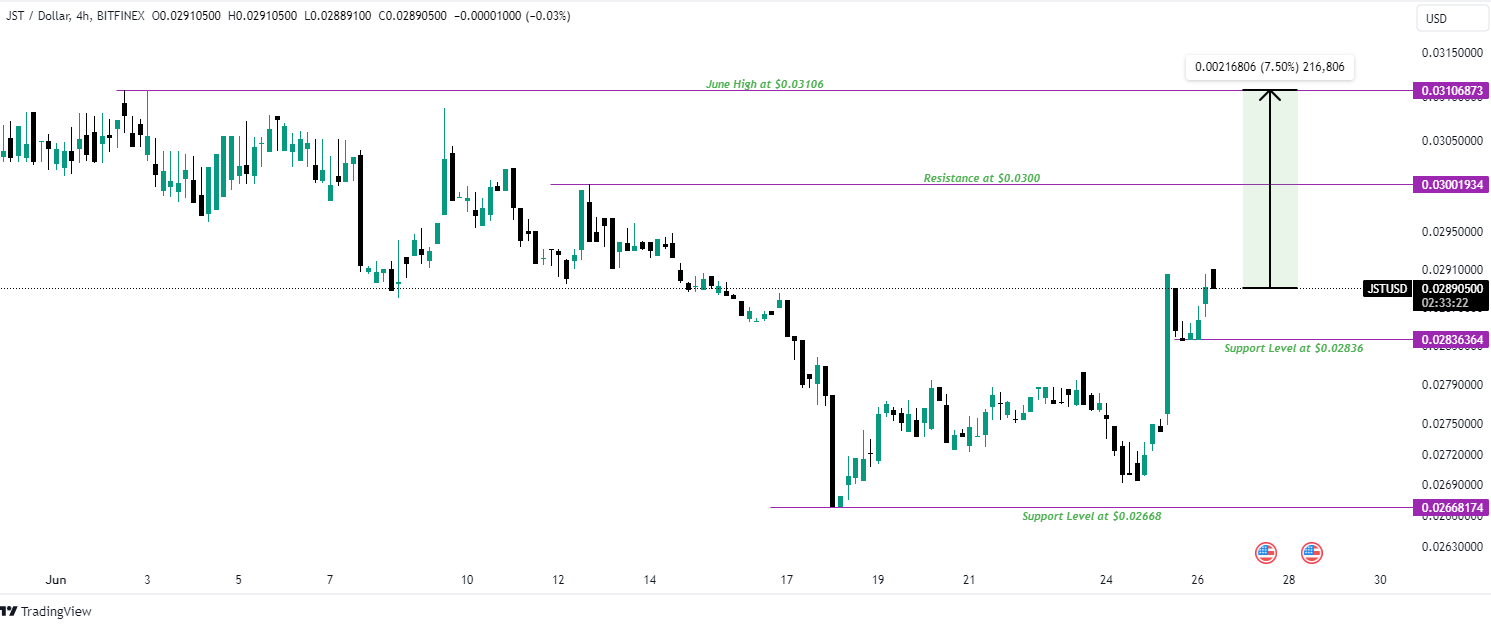
JST/USD 4-Hour Chart (Source: Tradingview )
However, the market scenario remains poised on a knife’s edge. If bearish sentiment takes hold, JST token holders may initially seek to find support around $0.02836. A breach below this level could expose more resounding support around $0.02668, last tested on June 18th.
Disclaimer: The information presented in this article is for informational and educational purposes only. The article does not constitute financial advice or advice of any kind. Coin Edition is not responsible for any losses incurred as a result of the utilization of content, products, or services mentioned. Readers are advised to exercise caution before taking any action related to the company.


