Bitget: #4 mondial en volume de trading quotidien!
Part de marché du BTC63.91%
Nouveaux listings sur Bitget : Pi Network
BTC/USDT$96360.36 (-0.70%)Indice Fear and Greed65(Euphorie)
Altcoin Season Index:0(Saison du Bitcoin)
Total des flux nets des ETF Spot Bitcoin +$674.9M (1j) ; +$2.63B (7j).Pack de bienvenue pour les nouveaux utilisateurs d'une valeur de 6200 USDT.Récupérer
Tradez à tout moment et en tout lieu grâce à l'application Bitget ! Télécharger maintenant


Prix de BounceBitBB
Listé
Devise de cotation:
EUR
€0.1066-7.59%1D
Convertisseur BB vers EUR
BB
EUR
1 BB = 0.00 EUR
Bitget offre les frais de trading les plus bas parmi les principales plateformes d'échange. Plus votre niveau VIP est élevé, plus les frais sont avantageux.
Graphique de prix
TradingView
Capitalisation
Graphique de prix BounceBit (BB/EUR)
Dernière mise à jour : 2025-05-03 20:52:01(UTC+0)
Capitalisation boursière:€55,509,623.9
Capitalisation entièrement diluée:€55,509,623.9
Volume (24h):€6,631,678.43
Vol. (24h) / Cap. boursière:11.94%
Haut (24h):€0.1162
Bas (24h):€0.1053
Record historique (ATH):€0.7658
Plus bas niveau historique:€0.07248
Offre en circulation:520,828,770 BB
Offre totale:
2,100,000,000BB
Taux de circulation:24.00%
Offre maximale:
2,100,000,000BB
Prix en BTC:0.{5}1250 BTC
Prix en ETH:0.{4}6555 ETH
Prix avec la capitalisation du BTC:
€3,250.9
Prix avec la capitalisation de l'ETH:
€376.88
Contrats:
0xd459...01073a3(Ethereum)
Plus
Que pensez-vous de BounceBit aujourd'hui ?
Remarque : ces informations sont données à titre indicatif.
Rapport d'analyse IA sur BounceBit
Points clés du marché crypto aujourd’huiVoir le rapport
Prix de BounceBit du jour en EUR
Le prix en temps réel de BounceBit est de €0.1066 EUR aujourd'hui, avec une capitalisation boursière de €55.51M. Le prix de BounceBit a baissé de 7.59% au cours des dernières 24 heures, et le volume de trading sur 24 heures est de €6.63M. Le taux de conversion BB/EUR (BounceBit vers EUR) est mis à jour en temps réel.
Historique des prix de BounceBit (EUR)
Le prix de BounceBit enregistre -58.51% sur un an. Le prix le plus élevé de BB en EUR au cours de l'année écoulée est de €0.7658 et le prix le plus bas de BB en EUR au cours de l'année écoulée est de €0.07248.
HeureVariation de prix (%) Prix le plus basPrix le plus élevé
Prix le plus basPrix le plus élevé 24h-7.59%€0.1053€0.1162
7d-11.94%€0.1053€0.1225
30d+6.53%€0.07248€0.1232
90d-41.32%€0.07248€0.1809
1y-58.51%€0.07248€0.7658
Tous les temps-61.94%€0.07248(2025-04-09, il y a 25 jour(s) )€0.7658(2024-06-06, il y a 332 jour(s) )
Quel est le prix le plus élevé de BounceBit ?
Le record historique (ATH) de BounceBit en EUR est de €0.7658, enregistré le 2024-06-06. Par rapport à l'ATH de BounceBit, le prix actuel de BounceBit est inférieur de 86.08%.
Quel est le prix le plus bas de BounceBit ?
Le plus bas niveau historique (ATL) de BounceBit en EUR est de €0.07248, enregistré le 2025-04-09. Par rapport à l'ATL de BounceBit, le prix actuel de BounceBit est supérieur de 47.04%.
Prédiction de prix de BounceBit
Quel est le bon moment pour acheter BB ? Dois-je acheter ou vendre BB maintenant ?
Lorsque vous décidez d'acheter ou de vendre BB, vous devez d'abord tenir compte de votre stratégie de trading. L'activité de trading des traders à long terme sera également différente de celle des traders à court terme. L'analyse technique Bitget de BB peut vous fournir une référence pour le trading.
Selon l'analyse technique de BB (4h), le signal de trading est Vente.
Selon l'analyse technique de BB (1j), le signal de trading est Vente.
Selon l'analyse technique de BB (1w), le signal de trading est Vente forte.
Quel sera le prix de BB en 2026 ?
En se basant sur le modèle de prédiction des performances historiques de BB, le prix de BB devrait atteindre €0.1617 en 2026.
Quel sera le prix de BB en 2031 ?
En 2031, BB devrait voir son prix augmenter de +42.00%. D'ici la fin de l'année 2031, BB devrait voir son prix atteindre €0.2107, avec un ROI cumulé de +97.12%.
FAQ
Quel est le prix actuel de BounceBit ?
Le prix en temps réel de BounceBit est €0.11 (BB/EUR) avec une capitalisation actuelle de €55,509,623.9 EUR. La valeur de BounceBit connaît des fluctuations fréquentes en raison de l'activité continue, 24 heures sur 24 et 7 jours sur 7, du marché des cryptomonnaies. Le prix en temps réel de BounceBit et ses données historiques sont disponibles sur Bitget.
Quel est le volume de trading sur 24 heures de BounceBit ?
Au cours des dernières 24 heures, le volume de trading de BounceBit est de €6.63M.
Quel est le record historique de BounceBit ?
Le record historique de BounceBit est de €0.7658. Il s'agit du prix le plus élevé de BounceBit depuis son lancement.
Puis-je acheter BounceBit sur Bitget ?
Oui, l'achat de BounceBit est actuellement disponible sur la plateforme d'échange centralisée Bitget. Pour des instructions plus détaillées, pensez à consulter notre guide pratique Comment acheter bouncebit .
Puis-je gagner des revenus réguliers en investissant dans BounceBit ?
Bien entendu, Bitget fournit une plateforme de trading de stratégie, avec des bots de trading intelligents permettant d'automatiser vos trades et d'engranger des bénéfices.
Où puis-je acheter des BounceBit au meilleur prix ?
Nous avons le plaisir d'annoncer que plateforme de trading de stratégie est désormais disponible sur la plateforme d'échange Bitget. Bitget offre les frais de trading les plus bas du secteur ainsi qu'une profondeur importante afin d'assurer des investissements rentables aux traders.
Actualités BounceBit
Afficher plus
Mises à jour BounceBit
Marché BounceBit
Avoirs BounceBit par concentration
Baleines
Investisseurs
Particuliers
Adresses BounceBit par durée de détention
Holders
Cruisers
Traders
Graphique en temps réel du prix de coinInfo.name (12)

Prix de BounceBit mondiaux
Combien vaut actuellement BounceBit dans d'autres devises ? Dernière mise à jour : 2025-05-03 20:52:01(UTC+0)
BB en MXN
Mexican Peso
Mex$2.36BB en GTQGuatemalan Quetzal
Q0.93BB en CLPChilean Peso
CLP$113.96BB en UGXUgandan Shilling
Sh441.86BB en HNLHonduran Lempira
L3.14BB en ZARSouth African Rand
R2.22BB en TNDTunisian Dinar
د.ت0.36BB en IQDIraqi Dinar
ع.د158.23BB en TWDNew Taiwan Dollar
NT$3.7BB en RSDSerbian Dinar
дин.12.46BB en DOPDominican Peso
RD$7.09BB en MYRMalaysian Ringgit
RM0.51BB en GELGeorgian Lari
₾0.33BB en UYUUruguayan Peso
$5.05BB en MADMoroccan Dirham
د.م.1.12BB en AZNAzerbaijani Manat
₼0.2BB en OMROmani Rial
ر.ع.0.05BB en KESKenyan Shilling
Sh15.58BB en SEKSwedish Krona
kr1.16BB en UAHUkrainian Hryvnia
₴5.01- 1
- 2
- 3
- 4
- 5
Comment acheter BounceBit(BB)

Créez votre compte Bitget gratuitement
Inscrivez-vous sur Bitget avec votre adresse e-mail/numéro de téléphone portable et créez un mot de passe robuste pour sécuriser votre compte.

Vérifiez votre compte
Vérifiez votre identité en saisissant vos informations personnelles et en téléchargeant une photo d'identité valide.

Convertir BounceBit en BB
Choisissez parmi les cryptomonnaies à trader sur Bitget.
En savoir plusTrader des Futures perpétuels BB
Après vous être inscrit avec succès sur Bitget et avoir acheté des USDT ou des BB, vous pouvez commencer à trader des produits dérivés, y compris des Futures BB, et à trader sur marge pour augmenter vos revenus.
Le prix actuel de BB est de €0.1066, avec une variation de prix sur 24 heures de . Les traders peuvent tirer profit d'une position Futures BB long ou short.
Rejoignez le copy trading de BB en suivant des traders experts.
Après vous être inscrit sur Bitget et avoir réussi à acheter des USDT ou des BB, vous pouvez également vous lancer dans le copy trading en suivant des traders experts.
Nouveaux listings sur Bitget
Nouveaux listings

Acheter plus


Où puis-je acheter BounceBit (BB) ?
Achetez des cryptos sur l'application Bitget
Inscrivez-vous en quelques minutes pour acheter des cryptos par carte ou virement bancaire.
Section vidéo – vérifier son identité rapidement

Comment vérifier son identité sur Bitget et se protéger contre les fraudes
1. Connectez-vous à votre compte Bitget.
2. Si vous êtes nouveau sur Bitget, consultez notre guide sur comment créer un compte.
3. Survolez l'icône de votre profil, cliquez sur "Non vérifié" puis sur "Vérifier".
4. Choisissez le pays ou région d'émission de votre pièce d'identité et votre type de document, puis suivez les instructions.
5. Sélectionnez "Vérification mobile" ou "PC" selon votre préférence.
6. Saisissez vos informations personnelles, présentez une copie de votre pièce d'identité et prenez un selfie.
7. Enfin, soumettez votre demande pour terminer la vérification de l'identité.
Les investissements en cryptomonnaies, y compris l'achat de BounceBit en ligne sur Bitget, sont soumis au risque du marché. Bitget fournit des moyens faciles et pratiques pour vous d'acheter des BounceBit, et nous faisons de notre mieux pour informer pleinement nos utilisateurs sur chaque cryptomonnaie que nous offrons sur la plateforme d'échange. Toutefois, nous ne sommes pas responsables des résultats qui pourraient découler de votre achat de BounceBit. Cette page et toute information qui s'y trouve ne constituent pas une recommandation d'une quelconque cryptomonnaie.
Convertisseur BB vers EUR
BB
EUR
1 BB = 0.1066 EUR
Bitget offre les frais de trading les plus bas parmi les principales plateformes d'échange. Plus votre niveau VIP est élevé, plus les frais sont avantageux.
Notes BounceBit
Note moyenne de la communauté
4.4
Ce contenu est uniquement destiné à des fins d'information.
Bitget Insights
Abature
9h
HAEDAL PRICE PREDICTION, TRADING EXPERIENCE
Being me as a good, reasonable and potential trader with a good strategies and plan on trading for the clear and insight and understanding of the potential Price movement of any coins, if you're intending to invest in any coin you have to start thinking about potential Price trajectory,nor it not a right to invest, hold or trade in any coin.
Now I will begin to explain on #HAEDAL Price prediction for the Year 2025, before I reveal a good prediction, I have conducted a thorough analysis by using technical indicators for the clear insight on #HAEDAL Price prediction. Also I have take some factors that impact on price of #HAEDAL like partnership with the some #HAEDAL ecosyste, implementation of new technologies.
By looking all these analysis a holder or investor he will be informed make decision on whether to hold, buy, sell a #HAEDAL in 2025, an it will help them to determining if the price will surpass higher level in 2025. Also investors can have insight on potential market condition for them to make a good profit.
Currently the price of #HAEDAL is $0.18787 which is forecasted by using some technical indicators such as (RSI) (MA) (BB). By using these updated tools for learning technologie, we are able to systematical predict, evaluate and process the data by enabling us to make informed about #HAEDAL Price prediction. Here are the prediction from Month of May, August and December which will an hint or insight for the rest of the month.
From May 2025 the price is expected to hit $0.535429 as minimum Price, $ 0.54858 as average price and $0.597426 as maximum Price prediction, also August 2025 $0.573003 as minimum Price, $0.589911 as average price, and $0.657545 as minimum Price, also for the month of December $0.601184 as a minimum Price, $0.657545 as average price, and lastly $0.713906 as a maximum Price..
As a technical trader having a huge experience on trading on daily basis it is imperative to have access to the updated tools for you having an insight on any Price of coin so as to have good profit at the end of the investin, holding activities. Lastly by giving a well price prediction of #HAEDAL coin the Price will be around$0.657545 by providing all the necessary support it needs and recieved successfu, also by a well trader experience to find the price prediction on the current Year 2025.
#HAEDAL
#HAEDALpriceprediction
HAEDAL-21.01%
HOLD-2.90%

Trader5
4j
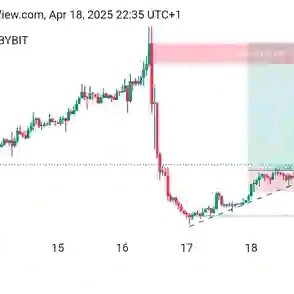
BITCOIN Why is this rally surprising you?
Bitcoin (BTCUSD) has completed 3 straight green weeks, wi
BITCOIN Why is this rally surprising you?
Bitcoin (BTCUSD) has completed 3 straight green weeks, with an impressive last 1W candle closing and started the new one right where it left. This rise shouldn't be surprising to most as it has fulfilled all the conditions that initiated all major rallies since the November 2022 Bear market bottom.
The first week of April rebounded strongly on the 1W MA50 (blue trend-line), which as mentioned numerous times on our channel, has been this Bull Cycle's main Support and kickstarted the Q4 2023 and Q4 2024 rallies.
At the same time, the 1W RSI broke last week above its MA, which has been the final confirmation of those Bullish Legs. With the 1W Bollinger Bands (BB) still ranged, the top trend-line is expected to rise aggressively as BTC's uptrend accelerates, something that resembles October 2023 and October 2024.
Throughout this Bull Cycle, those rallies have lasted around the same time, the longest being 14 weeks. As a result, the latest the current Bullish Leg tops should be on the week of July 14 2025 and a +92% rise as February - March 2024 should deliver a test of the Higher Highs trend-line around $140000.
$BTC
BTC-0.54%
BLUE-4.16%
GAJIDA2019
2025/04/27 08:41
KNOW YOUR INDICATORS
yesterday BB
today BBW
did you know what BBW stand for
B Bollinger
B Bands
W Width
$CORE $ETH $SOL $BTC $PEPE $BOME $PI
#BTC#SOL#ETH#CORE #BOME#PEPE #PI
BTC-0.54%
CORE-8.23%

Coinedition
2025/04/26 17:35
ALPACA Prediction for April 27th Hinges on Battle Between Squeezed Shorts and Overbought Signals
Alpaca Finance (ALPACA) stunned the crypto market with an unexpected surge, when the token price skyrocketed from $0.03 to a peak of $0.217 in just two days, a jaw-dropping 7x rally. This happened right after Binance announced on April 24th it would delist ALPACA on May 2nd.
As one would expect, ALPACA initially nosedived, shedding 20% of its value within hours as traders rushed to exit.
However, the expected dump turned into a massive pump. This counterintuitive rally was likely driven by a classic short squeeze. ALPACA’s pump narrative would have been: as traders aggressively shorted ALPACA, expecting further collapse, whales seized the opportunity. Short-sellers were forced to close their positions as the price climbed sharply, causing a cascading effect of liquidations that fueled further gains.
Altcoin analyst Wise Advice summed it up best :
“Whales are manipulating the price and liquidating shorts. We’ve seen this many times — whales pump the price to lure retailers in, only to use them as exit liquidity.”
Currently, $ALPACA remains up nearly 80% in the past 24 hours, trading around $0.1902 after touching an intraday high of $0.2089.
Related: Here Are Binance’s New Rules for Listing Tokens on Spot, Futures, and Alpha
The drama is reflected in the ALPACA perpetual futures market on Binance. The funding rate there became extremely negative, hitting rates as high as -24% per day. Simply put, short sellers are paying an enormous premium just to keep their bearish bets open. Analyst Onchainquant pointed out :
“Funding now pays 2% every hour — 48% a day! Shorts must close positions, creating potentially $50M in forced buy pressure into delisting.”
Adding to the tension is the huge $79 million in open interest (total value of open futures contracts) compared to ALPACA’s relatively small market cap of about $28 million. This extreme imbalance suggests more violent short squeezes or sharp price drops could still happen before the May 2nd delisting.
Looking at the technical chart, ALPACA price has exploded outside the upper Bollinger Band, suggesting a highly overbought condition. Typically, after such an aggressive breakout, price tends to consolidate or pull back towards the middle BB (currently around $0.055) before the next big move.
Meanwhile, the MACD has made a steep bullish crossover with wide separation between the MACD line and the signal line, a textbook signal of bullish momentum. However, such sharp MACD rises often precede corrections once momentum peaks.
Related: Another Round of Delistings on Binance — Is Your Favorite Token at Risk?
If the $0.1550 price level fails to hold, deeper pullback targets are $0.12 (key breakout retest zone) and $0.055 (middle BB support).
Disclaimer: The information presented in this article is for informational and educational purposes only. The article does not constitute financial advice or advice of any kind. Coin Edition is not responsible for any losses incurred as a result of the utilization of content, products, or services mentioned. Readers are advised to exercise caution before taking any action related to the company.
UP-1.95%
ALPHA-10.93%

Umer264
2025/04/26 11:45
INIT Token Price Prediction 2025
INIT Token Price Prediction 2025
The price forecast for the year 2025 depends largely on market conditions and the state of post-launch developments. In a bearish case, prices could dip as low as $0.25-$0.35 on weak sentiment or sell-off after the Token Generation Event (TGE). A middle ground here gives the price range of $0.40-$0.65 under normal growth. If the token manages to launch its mainnet successfully and scale its ecosystem, the coin would have a fair chance of reaching levels between $1.00-$2.50 through heavy adoption and with investor confidence.
If the coin executes on its multichain vision and gains early developer traction, it could emerge as a leading modular Web3 protocol second only to Celestia and, in the next 12-18 months, merit an FDV of $2.5 billion.
Initia (INIT) Price Predictions 2033
Our Initia price forecasts are derived utilizing a combination of advanced algorithmic techniques, which meticulously analyze key technical indicators such as the relative strength index (RSI) moving average convergence divergence (MACD), moving average (MA), average true range (ATR) and bollinger bands (BB) for each individual cryptocurrency. By utilizing cutting-edge machine learning technology, we are able to systematically evaluate and process this data, enabling us to make informed predictions about the potential trajectory of Initia prices. With our advanced technical analysis, we strive to provide our clients with the most accurate and reliable Initia price predictions available in the market today.
Initia (INIT) Market Forecast 2033
The cryptocurrency market is characterized by its high volatility, making it a challenging environment for price forecasting. Due to the dynamic nature of the market, any predictions made on our website should be viewed as speculative in nature and not as definitive financial guidance. As an individual trader, it is imperative that you conduct thorough technical analysis and due diligence before making any investment decisions. We strongly advise consulting with a licensed financial advisor before committing any capital to the market.
Initia (INIT) Price Prediction January 2033
Our algorithm has gathered data which predicts that Initia could end the month of January 2033 at a maximum price of $9.27 followed by a minimum price of $9.07. The average price that INIT can witness in January will be around $9.23.
Initia (INIT) Price Prediction February 2033
The Initia price prediction for February 2033 expects that the cryptocurrency may reach a maximum price of $9.34 while the minimum expected price is around $9.20. The average price that is predicted for February is $9.26.
Initia (INIT) Price Prediction March 2033
Initia is forecasted to reach a maximum price of $9.42 as March 2033 begins and it's possible to see it dip to $9.23 as the month ends. Furthermore, the average price of the cryptocurrency in March is $9.31 as bulls and bears continue to struggle for dominance.
Initia (INIT) Price Prediction April 2033
The market dominance of Initia is expected to surge in the long term but as April 2033 starts, the maximum price of INIT in April could near $9.51. The forecasted low is around $9.29 while the average price for Initia in April could be $9.35.
Initia (INIT) Price Prediction May 2033
For the month of May 2033, our Initia price prediction esimates that INIT could witness a maximum price of $9.60 followed by an average price of $9.38. The minimum price expected for May is around $9.32.
$INIT
INIT-3.60%
NEAR-2.58%
Actifs liés
Cryptos populaires
Sélection des 8 principales cryptomonnaies par capitalisation boursière.


Récemment ajoutées
Les cryptomonnaies les plus récemment ajoutées.


.png)


Capitalisation boursière comparable
Parmi tous les actifs Bitget, ces 8 actifs sont les plus proches de BounceBit en termes de capitalisation boursière.


Infos complémentaires sur BounceBit
Détails de la crypto
En lien avec la crypto
En lien avec le trading
Actualités de la crypto
Trading
Earn
BB est disponible pour le trading sur Bitget, et peut être conservé en garde sur Bitget Wallet. Bitget est également l'une des premières plateformes d'échange centralisées à prendre en charge le trading de BB.
Vous pouvez trader BB sur Bitget.BB/USDT
SpotBB/USDT
MargeBB/USDT
Futures USDT-M