Sonic (S) To Continue Rebound? Key Harmonic Pattern Signaling an Upside Move

Date: Sat, April 26, 2025 | 05:55 AM GMT
After a rough start to 2025, where even Ethereum (ETH) tanked by 45% in Q1, the crypto market is finally flashing signs of life. ETH is up 16% over the past week, and this bullish momentum is now spilling over into major Altcoins .
One such altcoin making a strong comeback is Sonic (S). After experiencing a heavy sell-off, S has surged by nearly 17% over a week—cutting its year-to-date losses down to about 32%. And now, a key harmonic pattern is forming, hinting that the recovery may not be over just yet.
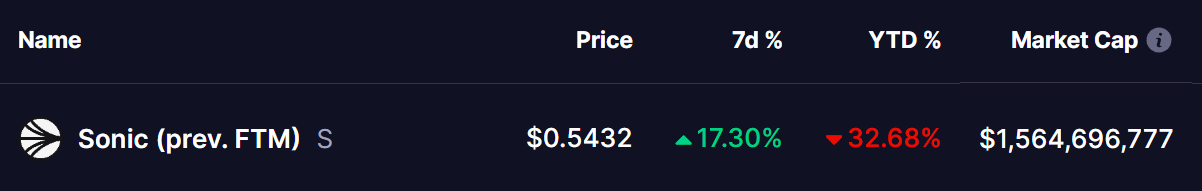 Source: Coinmarketcap
Harmonic Pattern Signals More Upside Move
Looking at the daily chart for Sonic (S) with Heikin Ashi candles, a Bearish Butterfly pattern has clearly developed — but interestingly, it points to more upside before any potential reversal happens.
The downtrend began in late March when S failed to hold above the $0.6372 level (point X). From there, the price fell sharply, bottoming out around $0.3787 (point A) on April 9.
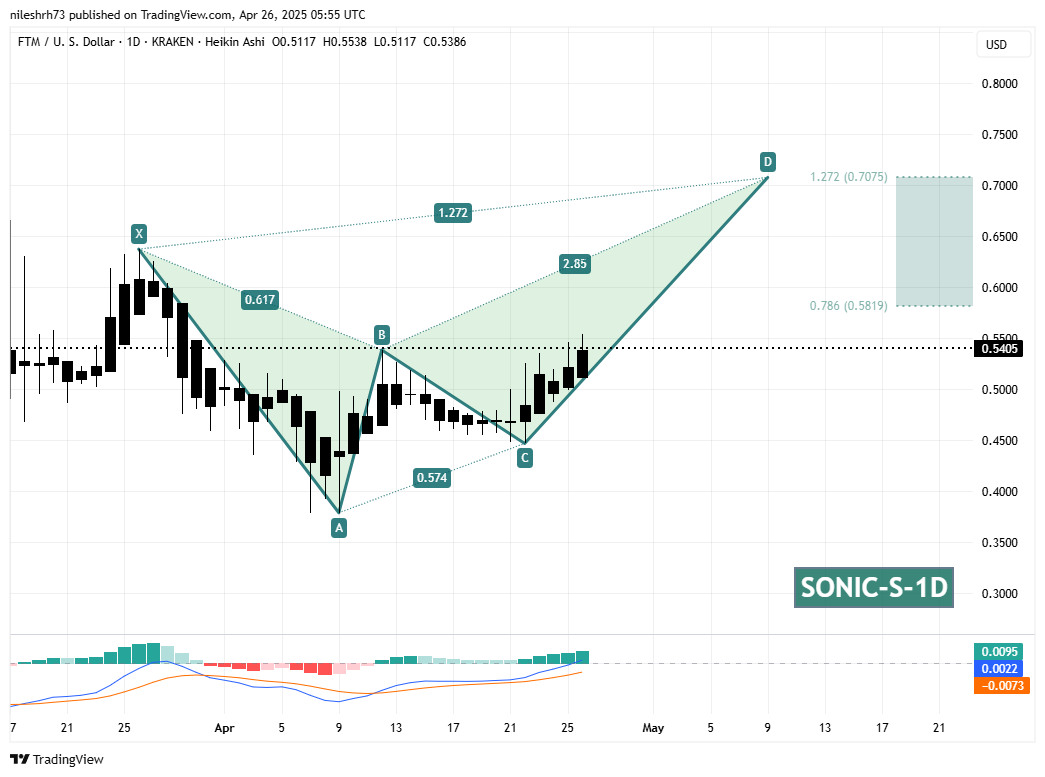 Sonic (S) Token Price/Coinsprobe (Source: Tradingview)
After finding a strong support zone, S reversed higher, forming a healthy BC retracement and now building the CD leg. Currently, S trades near $0.54, showing steady bullish momentum within the harmonic setup.
The D point of this pattern — the typical reversal zone — is projected at the 1.272 Fibonacci extension of the XA leg, which lands near $0.7075. This suggests that S could still rally another 30% from the current levels before facing any strong selling pressure.
What’s Next for Sonic (S)?
Sonic (S) is trading in a critical resistance zone on the CD leg — an area that could trigger either profit-taking or a quick acceleration depending on momentum.
Before reaching the final D point, the coin must first break above the intermediate resistance at $0.5859, which coincides with the 0.786 Fibonacci retracement level. A solid breakout from there could send S flying toward the final butterfly target much faster.
On the technical side, the structure remains bullish. The MACD indicator is also turning positive, with a bullish crossover showing early signs of growing momentum. Moreover, the recent series of higher lows supports the idea that buyers are stepping in consistently.
Disclaimer: This article is for informational purposes only and not financial advice. Always conduct your own research before investing in cryptocurrencies.
Disclaimer: The content of this article solely reflects the author's opinion and does not represent the platform in any capacity. This article is not intended to serve as a reference for making investment decisions.
You may also like
Bitcoin ETFs Experience Influx Amid Positive Sentiment Shift in Crypto Market


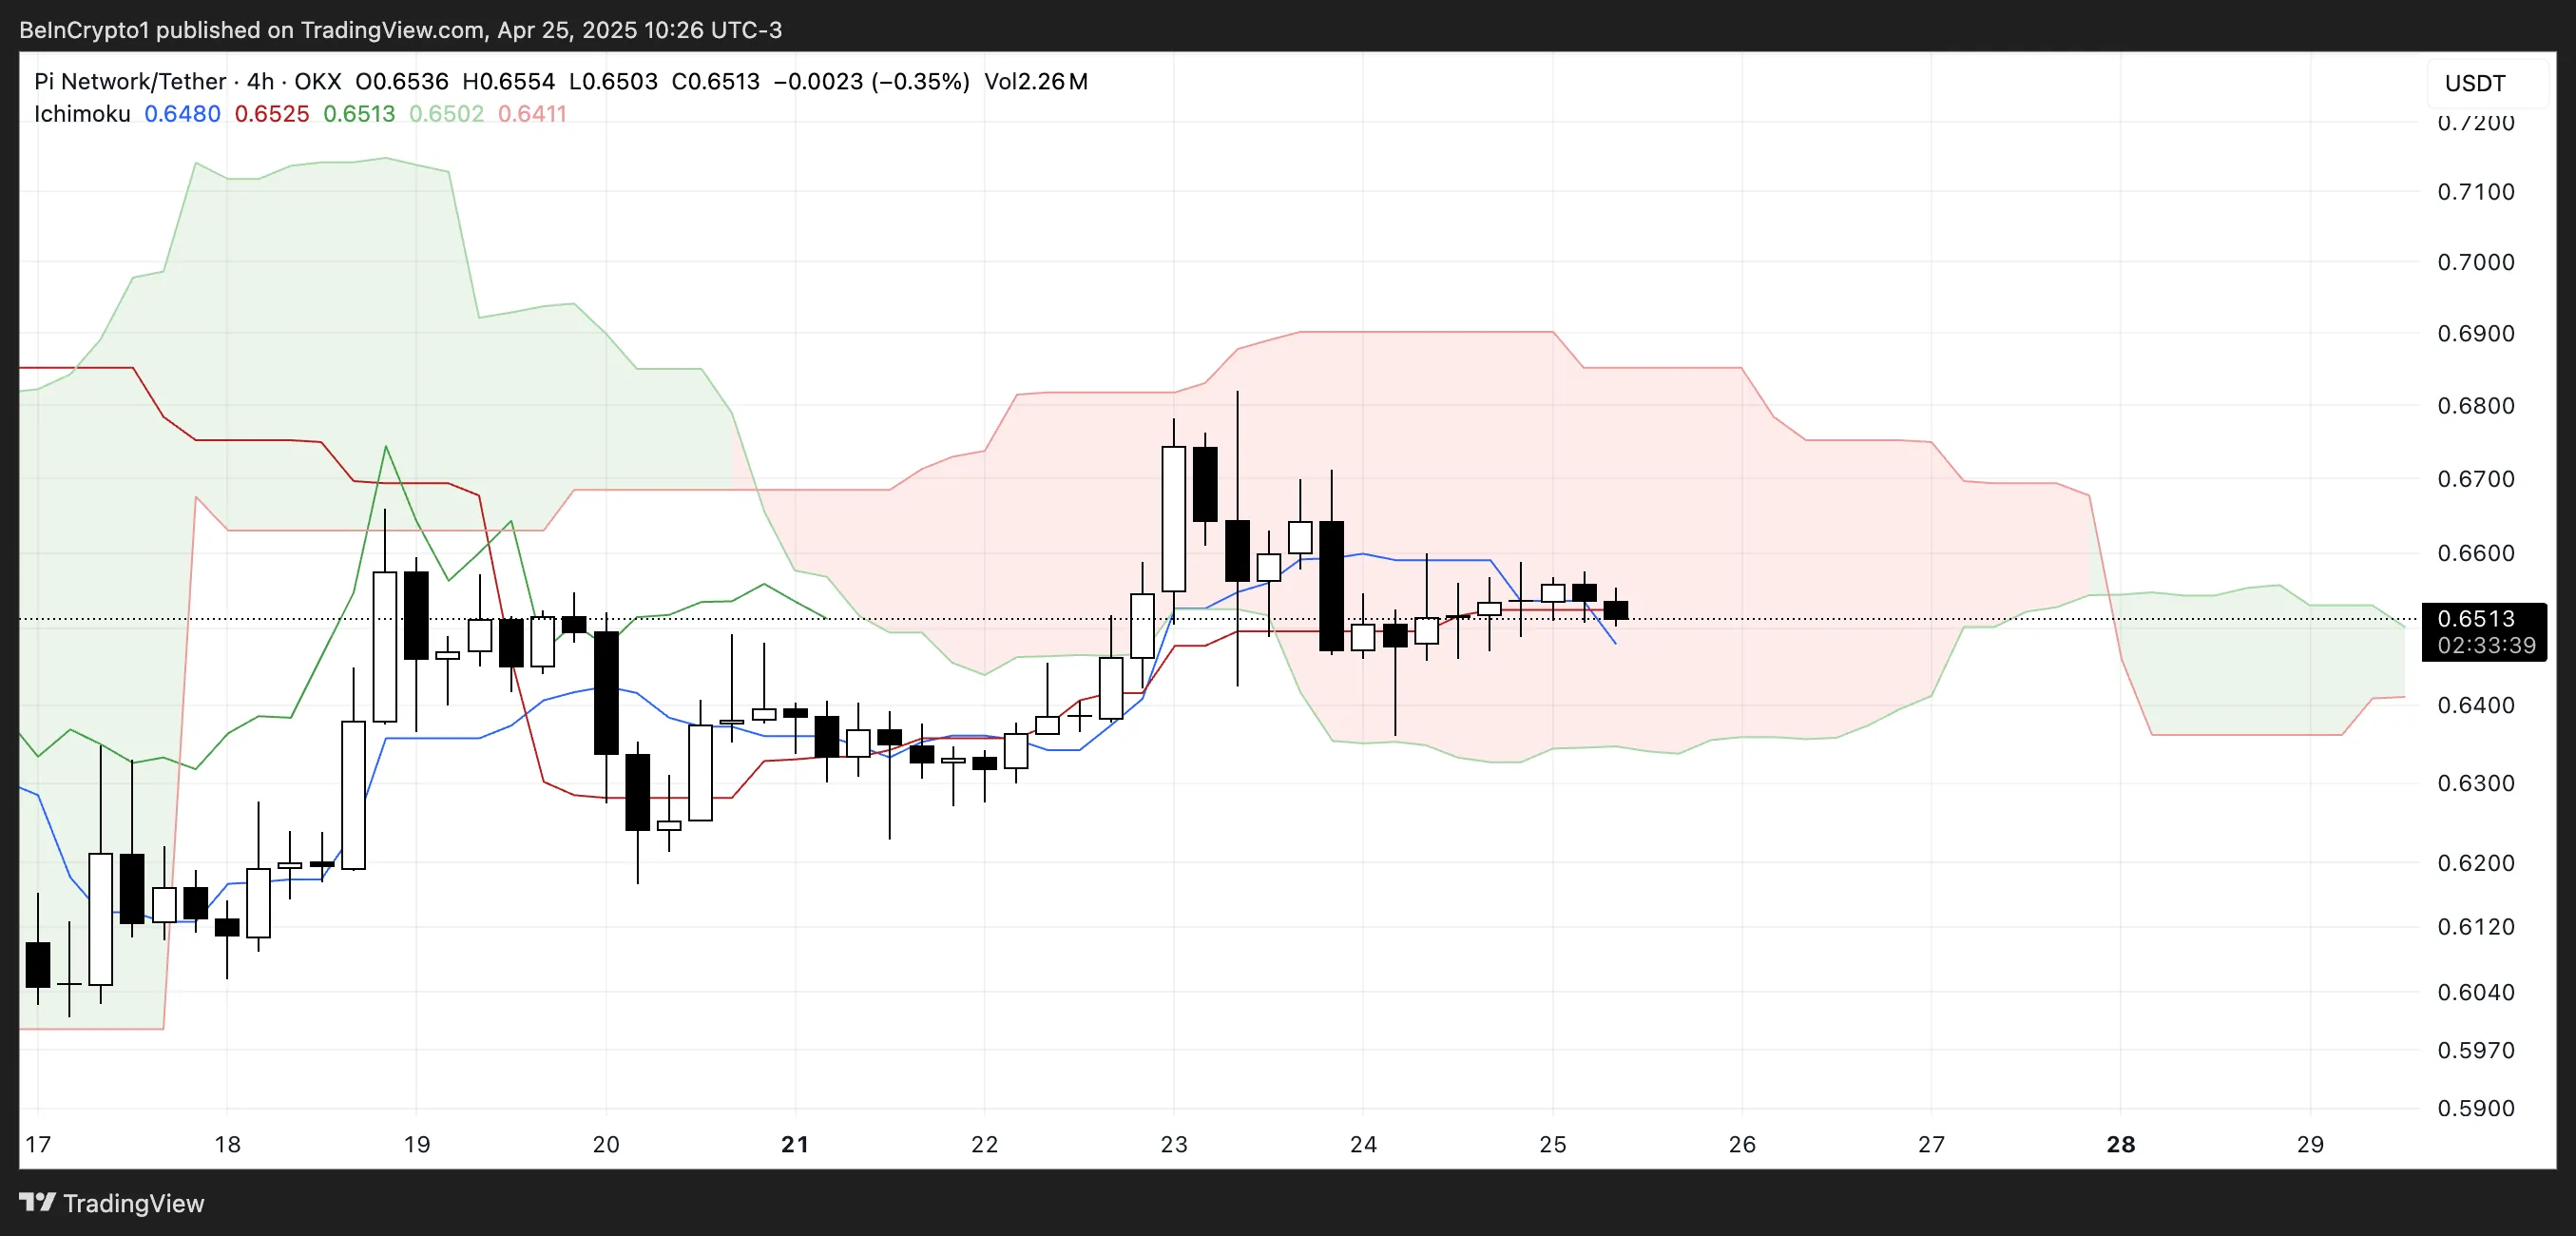
Pi Network Price Consolidation Holds Key to Possible Breakout Above $0.68
ARK Invest’s Bitcoin Forecast: Exploring Potential Paths to $2.4 Million Amid Adoption Concerns